Distributed Logging & it's best practices
•
• Engineering

A log is perhaps the simplest possible storage abstraction. It is an append-only, totally-ordered sequence of records ordered by time.
As we all know Distributed system is composed of several applications calling each other to complete one operation. We might need to talk to multiple services running on different machines to fulfil a single business requirement. So, the log messages generated by microservices are distributed across multiple hosts.
What’s much harder is to make sense of this ocean of logs from a logical point of view. Here is what centralized logging comes to the rescue.
What is Centralized Logging?
Centralized logging refers to the aggregation of data from individual microservices in a central location for easier access and analysis.
Centralized logging collects and aggregates logs from multiple services into a central location where they are indexed in a database. The log data can be searched, filtered, and grouped in the log management software by fields like status, host, severity, origin, and timestamp.
Design and configuration of centralized logging followed at SIXT:
Centralized Logging(EFK Stack):
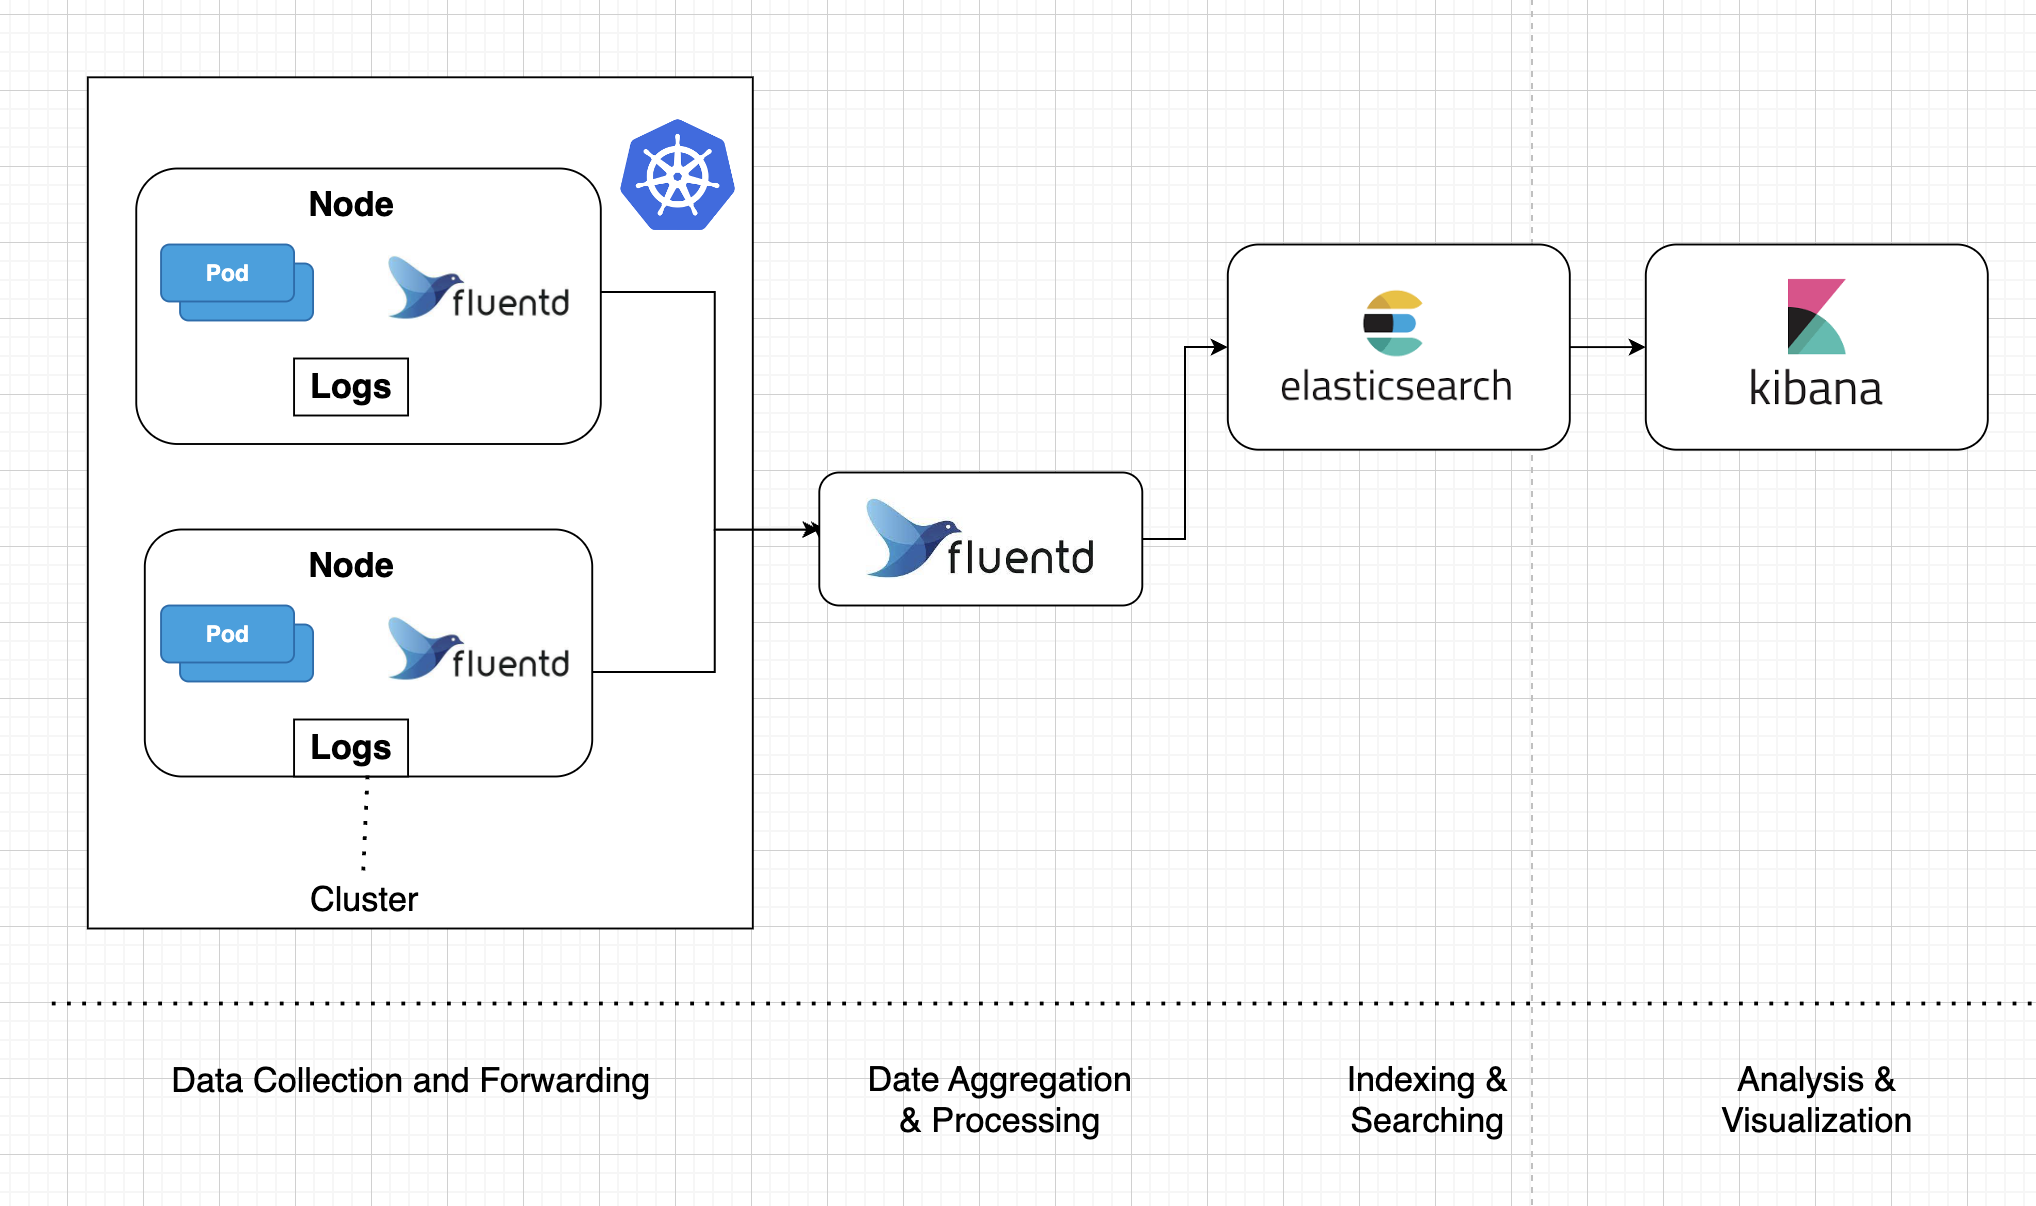
The basic idea is that a logging agent on every machine will collect log data and forward it to a cluster of machines for aggregation and storage in ElasticSearch. We can then build dashboards using Kibana to visualize and filter the log data within ElasticSearch.
This design consists of 4 sections:
● Collection: Each host runs a Fluentd agent responsible to collect the log info from various locations & forward it to a cluster of machines for aggregation. Every log message coming into Fluentd will be “enriched” by having tags added.
● Aggregation: The aggregation will be handled by a group of machines also running Fluentd, but with a different configuration.
● Indexing and Searching: Raw data flows into Elasticsearch from a various sources, including logs, system metrics, and web applications. Data ingestion is the process by which this raw data is parsed, normalized, and enriched before it is indexed in Elasticsearch. Once indexed, users can run complex queries against their data and use aggregations to retrieve complex summaries of their data.
● Visualization: Kibana is a data visualization and management tool for Elasticsearch that provides real-time histograms, line graphs, pie charts, and maps.
Now that we have collected and aggregated logs from multiple services into one centralized location, the next challenge is to correlate the log records coming from different applications to get a logical view of all records relevant to processing a specific request. Typically, this means adding some HTTP headers on the client side and reading them on the server side.
Let’s discuss some of the best practices to follow in Microservices logging, to address the loosely coupled, modular nature of microservice architecture.
The goal is to bring coherence to the system for more efficient and accurate troubleshooting and debugging.
1: Correlating requests:
Each service in a microservice system interacts with the others to fulfil a request. Tagging the initial request with a unique ID allows you to easily track it through the system, identify potential errors and reveal whether they were caused by the previous service request or the next one. A developer can enter that unique ID into the log aggregator search engine to pull up the logs from all services for analysis. The common approach is using Correlation IDs: Generate a correlation ID when you are making the first microservice call and pass that same ID to downstream services. Log the correlation ID across all microservice calls. That way, we can use the correlation ID from the response to trace the logs.
2: Logging information:
More log information means more context to help the user understand a problem. The name of the service generating the log message, correlation ID, the IP address of the server and the client making the request, and the date and time the message was sent and received are just a few of the data points you should consider including.
3: Structured Logging:
Use structured logging. That is, instead of baking information into a string (e.g. “User krufty could not reserve vehicle v2828. It is already blocked by journey 12323–2534–23223”), we keep the info separate (e.g. message=” Vehicle reservation failed”, user=”krufty”, vehicle=”v2828”, currentOwner=”12323–2534–23223”). This way, we don’t need fancy parsing or full-text searches if we want to get all logging events that correlate to vehicle v2828.
4: Don’t include sensitive information:
Logs must not contain sensitive information such as personally identifiable information, credentials, secrets, credit cards, etc. While your service may authorize access to this information, the logs are open to a larger audience (e.g. all developers).
Conclusion:
Centralized logging is an important component of any production-grade infrastructure, but it is especially critical in a containerized architecture. Proper monitoring and logging by following best practices could ease the life of an engineer during debugging process. That’s all for now, thank you for reading.
References:
https://www.splunk.com/en_us/data-insider/what-is-distributed-tracing.html
https://solace.com/blog/event-driven-logging-with-elastic-stack/
https://gregoryszorc.com/blog/category/logging/
https://engineering.linkedin.com/distributed-systems/log-what-every-software-engineer-should-know-about-real-time-datas-unifying