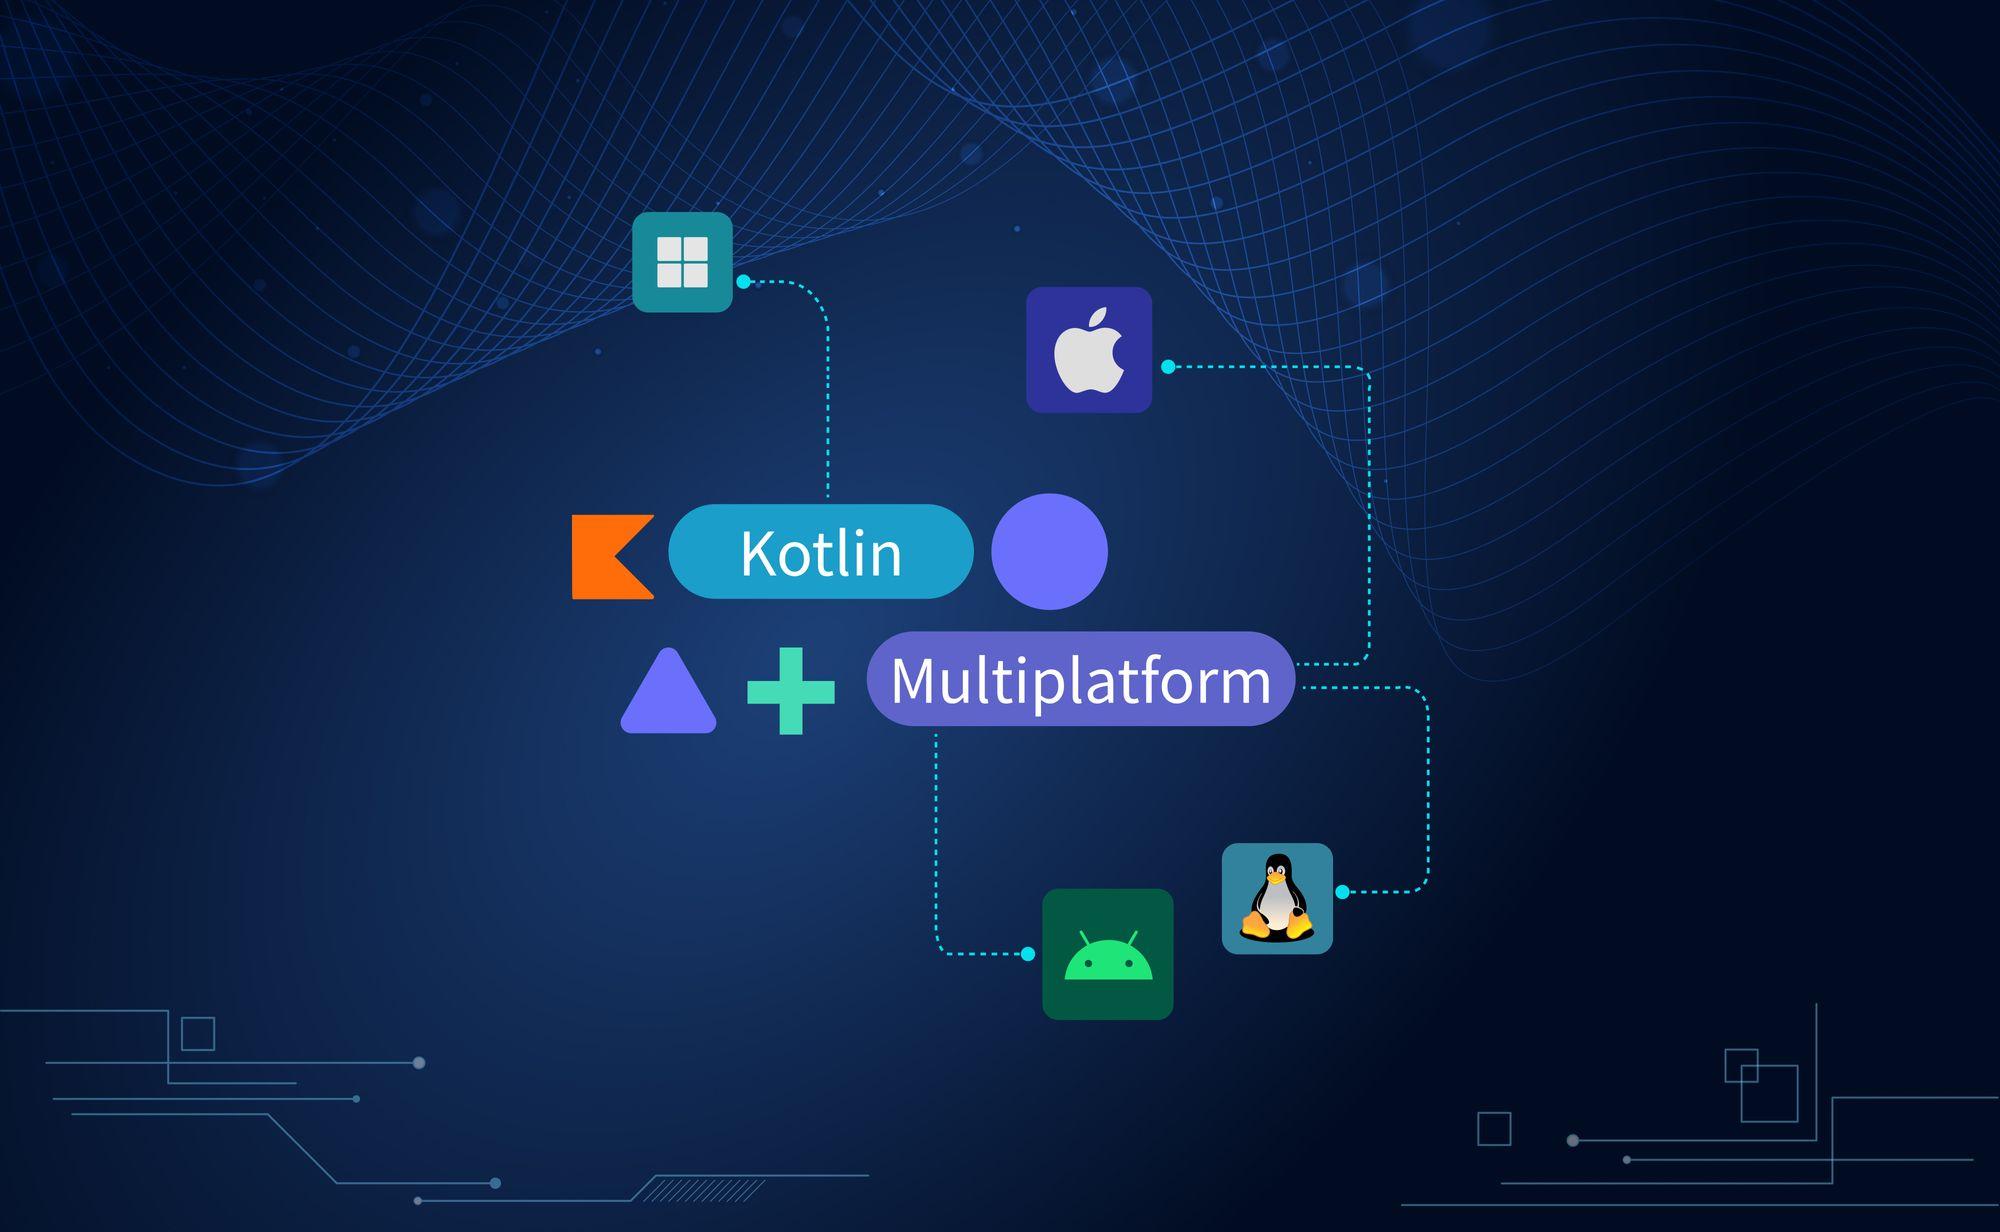
Kotlin Multiplatform (KMP): One Codebase, Many Platforms
Introduction
Kotlin Multiplatform (KMP) is JetBrains’ solution for teams who want to share logic across platforms — built for teams who want to share logic without giving up native UI.
Unlike Flutter or React Native, KMP doesn’t replace your UI layer — it complements it. You still write SwiftUI, Jetpack Compose, or React components natively, ensuring platform-native performance and APIs. It’s about sharing logic, not necessarily UI — although UI sharing is possible with frameworks like Compose Multiplatform.Note: Compose Multiplatform extends KMP by also sharing UI code (using Jetpack Compose), but that’s optional — KMP works just fine without it.
KMP is Gradle-driven, compiles Kotlin to each platform’s native/bytecode target, and exposes Kotlin artifacts you can consume directly from platform code.
Why Use KMP
- Less duplicate logic: single implementation for algorithms, validation, networking.
- Consistency: same models, serializers, and business rules across platforms.
- Maintainability: fixes and features applied once propagate everywhere.
- Flexibility: keep platform-specific UI idiomatic (Compose on Android, SwiftUI on iOS).
- Incremental adoption: migrate small pieces at a time — no big-bang rewrite.
️ Core Concepts
Targets
KMP compiles shared code to platform-specific artifacts. Common targets include:
android()orjvm()— compiles to Java bytecode (Android builds into an AAR).iosX64,iosArm64,iosSimulatorArm64— iOS frameworks (Objective-C/Swift interop).js()— compiles to JavaScript (Node/browser).wasmJs()— compiles to WebAssembly for high-performance web applications.macosX64,linuxX64,mingwX64— native/desktop targets.
Source Sets
Source sets organize shared and platform-specific code.
commonMain/commonTest: shared code and tests.androidMain,iosMain,jvmMain: platform implementations.expectandactual: expect and actual are Kotlin’s mechanism for defining platform-agnostic APIs — more on this below
Example:
// commonMain
expect fun currentTimestampMillis(): Long

// androidMain
actual fun currentTimestampMillis(): Long = System.currentTimeMillis()

// iosMain
actual fun currentTimestampMillis(): Long = NSDate().timeIntervalSince1970.toLong() * 1000L
Expect / Actual Pattern
This pattern allows you to define APIs in shared code (
expect) and implement them in platform-specific code (actual).
It’s the foundation of how Kotlin Multiplatform abstracts platform differences.For example:
// commonMain
expect class Logger() {
    fun log(message: String)
}

// androidMain
actual class Logger {
    actual fun log(message: String) {
        Log.d("KMP", message)
    }
}

// iosMain
actual class Logger {
    actual fun log(message: String) {
        println("KMP: $message")
    }
}
You’ll often use this for:
- Logging
- File I/O
- Network clients (Ktor engines)
- Preferences
- System services (camera, GPS, etc.)
Interoperability
Kotlin Multiplatform integrates smoothly with each target’s ecosystem.
-
Android / JVM:
The shared module compiles to a.aaror.jarfile, consumed like any other Gradle dependency. -
iOS:
KMP outputs a.frameworkor.xcframeworkbundle exposing Objective-C headers.
Swift can then call shared Kotlin code directly. -
JavaScript:
Generates JS bundles for Node or browser, allowing Kotlin logic to be reused in web apps.
Example — importing shared code in Swift:
import Shared

let userRepo = SharedUserRepository()
userRepo.getUser(id: "42") { user, error in
    if let user = user {
        print(user.name)
    }
}
Build & Tooling
Gradle Setup
plugins {
    kotlin("multiplatform") version "1.9.x"  // Note: Replace .x with the latest stable version.
    id("com.android.library")
}

kotlin {
    android()
    iosX64()
    iosArm64()
    iosSimulatorArm64()

    sourceSets {
        val commonMain by getting {
            dependencies {
                implementation("org.jetbrains.kotlinx:kotlinx-coroutines-core:1.7.x")
                implementation("io.ktor:ktor-client-core:2.x")
            }
        }
    }
}
CocoaPods Integration
For iOS projects using CocoaPods, KMP supports automatic generation of
.podspecfiles.kotlin { cocoapods { summary = "Shared KMP Module" homepage = "https://yourcompany.dev" framework { baseName = "shared" } } }After running pod install, your iOS app can import Shared like any other pod.
For Swift Package Manager: KMP also supports SPM via XCFrameworks — run ./gradlew :shared:assembleXCFramework and add it to Xcode manually or via Package.swift.
Multiplatform Libraries Ecosystem
Several Kotlin libraries already support KMP out of the box, including:
- Ktor — Networking
- kotlinx.serialization — JSON serialization
- SQLDelight — Type-safe database
- Koin or Kotlin Inject — Dependency injection
- kotlinx.coroutines — Concurrency
These libraries expose a
commonMainimplementation and internally manage platform-specific code.
Networking & Serialization
Networking in KMP is commonly implemented using Ktor, and data models are serialized using kotlinx.serialization.
Example setup:
// commonMain
expect fun provideHttpClient(): HttpClient

// androidMain
actual fun provideHttpClient(): HttpClient = HttpClient(OkHttp)

// iosMain
actual fun provideHttpClient(): HttpClient = HttpClient(Ios)
Persistence
You can implement persistence in a multiplatform-friendly way using:
- SQLDelight — for type-safe local database access
- Settings library or
expect/actualfor key-value storage
Example using
expect/actualfor preferences:// commonMain expect class Preferences() { fun putString(key: String, value: String) fun getString(key: String): String? } // androidMain actual class Preferences { private val prefs = PreferenceManager.getDefaultSharedPreferences(context) actual fun putString(key: String, value: String) { prefs.edit().putString(key, value).apply() } actual fun getString(key: String): String? = prefs.getString(key, null) } // iosMain actual class Preferences { private val defaults = NSUserDefaults.standardUserDefaults() actual fun putString(key: String, value: String) { defaults.setObject(value, forKey = key) } actual fun getString(key: String): String? = defaults.stringForKey(key) }
Migration Strategy (From Android-only Kotlin)
One of Kotlin Multiplatform’s biggest advantages is that you don’t need to rewrite your entire app.
You can adopt it gradually — starting with isolated modules and expanding over time.Here’s a proven step-by-step migration plan:
1. Identify Reusable Logic
Start by locating modules that can easily be shared:
- Networking layer (API clients, DTOs)
- Models and serialization
- Business/domain logic
- Validation and utilities
Anything not tied to Android APIs (like
ContextorView) is a good candidate.2. Create a Shared KMP Module
Create a new Gradle module (e.g.,
/shared) using the Kotlin Multiplatform plugin:plugins { kotlin("multiplatform") id("com.android.library") }Configure targets for Android and iOS:
{
android()
iosX64()
iosArm64()
iosSimulatorArm64()
}
Add commonMain, androidMain, and iosMain source sets to start building shared functionality.
3. Move Common Code Incrementally
Move business logic, API definitions, and models from your Android module into commonMain. Replace Android dependencies (e.g., SharedPreferences) with expect/actual abstractions.
// commonMain
expect fun getAppVersion(): String

// androidMain
actual fun getAppVersion(): String =
BuildConfig.VERSION_NAME
4. Integrate Shared Code Back into Android
Once the shared module builds successfully, integrate it into your Android project.
In androidApp/build.gradle.kts:
implementation(project(":shared"))Now your Android app uses logic from the shared module transparently.
5. Generate the iOS Framework
Next, build the iOS target to generate an .xcframework:
./gradlew :shared:assembleXCFrameworkThis produces a Shared.xcframework which can be imported into Xcode.
In Swift:
import Shared

let repo = SharedUserRepository()
repo.fetchUser(id: "42") { user in
print(user.name)
}
6. Gradually Expand
Once both Android and iOS consume shared logic, you can migrate more modules:
-
Caching and persistence
-
Analytics
-
Feature toggles
-
Utility layers
Avoid moving platform-specific code (UI, sensors, Bluetooth, etc.) until you have solid common infrastructure.
Best Practices During Migration
- Keep commonMain platform-agnostic — no Android imports.
- Write shared unit tests early in commonTest.
- Use dependency injection for platform services.
- Test build pipelines on macOS early to avoid CI surprises.
- Document all expect/actual pairs to prevent confusion later.
Example of a Small First Step
- A realistic starting point is to share your networking layer.
- Create models and API clients in
commonMain. - Implement platform-specific HTTP engines (OkHttp for Android, Darwin for iOS).
- Verify integration on Android first, then export to iOS.
This way, you deliver immediate value while reducing risk.
1.Testing Strategy KMP supports shared unit tests in commonTest:
// Testing Shared Code
// commonTest
class UserRepositoryTest {
    @Test
    fun testUserParsing() {
        val user = User("John", 30)
        assertEquals("John", user.name)
    }
}
Run tests for all targets via:
./gradlew allTests-
Performance & Binary Size Address a common concern: Does KMP add bloat? Kotlin/Native binaries are optimized with tree-shaking and minification. Shared code typically adds minimal overhead compared to duplicating logic in Swift and Kotlin separately.
- Building KMP in CI/CD macOS runners required for iOS builds (GitHub Actions, Bitrise, etc.) Use ./gradlew build for all targets or separate jobs per platform Cache Gradle and CocoaPods dependencies to speed up builds
- Limitations Being honest about trade-offs builds trust: Current Limitations: iOS debugging experience is improving but not as mature as Android Some Kotlin/JVM libraries don’t support Kotlin/Native yet Swift interop for advanced generics can be tricky
Conclusion
Kotlin Multiplatform is not just another cross-platform framework — it’s a multi-target architecture built on top of Kotlin’s language power and Gradle’s flexibility.
Instead of forcing a single UI or runtime across devices, KMP gives you the freedom to share only what makes sense — your business logic, models, and data layers — while keeping the native experience intact for every platform.For Android developers, KMP feels natural. You can reuse your Kotlin skills, libraries, and build tools while extending your reach to iOS, Desktop, or even Web.
It enables consistency in logic, faster feature parity, and fewer bugs across platforms — without sacrificing performance or native design principles.The key to success with KMP lies in incremental adoption. Start small — share stable, core modules like networking or validation — then expand gradually as your team and tooling mature.
As the ecosystem evolves with Compose Multiplatform, SQLDelight, Ktor, and Kotlin/Native improvements, Kotlin Multiplatform is fast becoming a production-ready solution for modern, scalable, and maintainable mobile architectures.
read moreBuild once. Run everywhere. Stay native.
Is it the end of programming …?

In the early days, computer scientists wrote machine code containing raw instructions for computers, primarily to perform highly specific tasks. Throughout the 20th century, research in compiler theory led to the creation of high-level programming languages that use more accessible syntax to communicate instructions. Languages like ALGOL, COBOL, C, C++, Java, Python, and Go emerged, making programming less “machine-specific” and more “human-readable.” Every idea in classical computer science — from a database join algorithm to the mind-boggling Paxos consensus protocol — can now be expressed as a human-readable, comprehensible program.
In the early 1990s, AI was seen as a combination of algorithms used to make decisions to a certain extent. For example, algorithms in the supervised category, like Decision Trees and Random Forests, or in the unsupervised category, such as clustering and k-means, were more inclined toward probabilistic and statistical analysis of data. Although deep learning had its first methods in the late 1960s and 1970s, like backpropagation and convolutional neural networks, it remained in its infancy until the early 2000s. By 2011, the speed of GPUs had increased significantly, enabling the training of convolutional neural networks without layer-by-layer pre-training. With the increased computing speed, it became apparent that deep learning had significant advantages in terms of efficiency and speed.
The Generative Adversarial Network (GAN) was introduced in 2014 by Ian Goodfellow. With GAN, two neural networks learn by playing against each other in a game. This marked the beginning of understanding the power of training models with vast data and increasing computing power. GANs became a hit, producing unique human faces using images trained from across the internet. The fact that GANs could create a human face so convincingly that it could fool another human was both impressive and concerning.
The rise of AI and deep learning is a realization that these algorithms can now be “trained,” much like humans are trained in schools and colleges, and with the computing power at hand, this can happen in mere hours or days. Programming, as we know it, might become obsolete. The conventional idea of “writing a program” may be relegated to very specialized applications, with most software being replaced by AI systems that are “trained” rather than “programmed.” In situations where a “simple” program is needed, those programs will likely be generated by an AI rather than coded by hand.
No doubt, the earliest pioneers of computer science, emerging from the (relatively) primitive cave of electrical engineering, believed that all future computer scientists would need a deep understanding of semiconductors, binary arithmetic, and microprocessor design to understand software. Fast-forward to today, most software developers have almost no clue how a CPU actually works, let alone the physics underlying transistor design. The idea is simple: why reinvent the wheel when it already exists? Most programming languages nowadays have Standard Template Libraries (STLs), which means you don’t need to implement linked lists or binary trees yourself, or write Quicksort for sorting a list.
If you’re following AI trends, you’re likely aware of DALL-E, a deep learning model that creates images from text descriptions. Just 15 months after DALL-E’s release, DALL-E 2 was announced, offering more realistic and accurate representations with 4x more resolution. It’s easy to underestimate the power of increasingly large AI models. Building on this, DALL-E 3 further enhances the creative process by offering even more refined image generation, with improved coherence between text prompts and visual outputs.

AI coding assistants such as CoPilot are only scratching the surface of what I am describing. It seems totally obvious to me that *of course *all programs in the future will ultimately be written by AIs, with humans relegated to, at best, a supervisory role. And what blew everyone’s mind was when openAI announced chatGPT a sibling model to instructGPT (and god knows how many different flavours of GPT’s they have in there) which is trained to follow an instruction in a prompt and provide a detailed response. The extent to which chatGPT is able to go, explain and respond is phenomenal. It has successfully passed a Google Coding Interview for Level 3 Engineer With $183K Salary, MBA and law exams of prestigious universities , medical licensing exams and what not. You will not believe this until you try pushing the limits of how a conversational bot surpasses limits of your expectations: here.
As the GPT technology has evolved, so too has its specialization across various domains. These specialized GPTs are not just powerful but tailored for specific tasks, enhancing efficiency and effectiveness in ways that general-purpose models like ChatGPT cannot. It’s like a GPT marketplace where you can pick and choose specialised GPT’s for your tailored work.Here are a few examples:
-
CodeGPT: A specialized version of GPT tailored for coding tasks, CodeGPT assists developers by generating code snippets, fixing bugs, and even suggesting optimizations in various programming languages. It is designed to understand the context of code and provide solutions that align with best practices.
-
MedGPT: Focused on the medical field, MedGPT is trained on vast amounts of medical literature, research papers, and clinical data. It assists healthcare professionals in diagnosing conditions, recommending treatments, and even predicting patient outcomes based on historical data. MedGPT represents a significant leap in applying AI to healthcare, making expert knowledge more accessible.
-
LawGPT: This variant is designed for legal professionals, capable of drafting contracts, analyzing legal documents, and providing insights based on case law. LawGPT reduces the time spent on mundane legal tasks and enhances the accuracy and depth of legal analysis, making it a valuable tool in law firms and corporate legal departments.
-
FinGPT: Tailored for the finance industry, FinGPT excels in analyzing market trends, predicting stock movements, and even generating trading strategies. It leverages real-time financial data and historical trends to offer insights that can be crucial for making informed investment decisions.
-
ArtGPT: A creative-focused GPT, ArtGPT is designed for artists and designers. It can generate artwork, design concepts, and even assist in creating music or literature. ArtGPT’s ability to mimic various artistic styles and innovate within those frameworks makes it a unique tool for creative professionals.
These specialized GPTs demonstrate the potential of AI to go beyond general-purpose use cases, diving deep into specific industries and domains. They are not just tools but partners that augment human expertise, making complex tasks more manageable and efficient.
GPT-based AI bots are no longer just conversational bots. There’s now AI for every category, a phenomenon being called the “GPT effect”:
-
Search: Bing Search + ChatGPT answer search queries.
-
Design: Genius AI design companion, Galileo for converting text (ideas) to design instantly.
-
Summarization: ArxivGPT (Chrome extension) summarizes Arxiv papers.
-
Image Generation & Avatar: OpenJourney (Stable Diffusion text-to-image model), DALL-E 2, and AI avatars trending on social media. DALL-E 3, integrated into ChatGPT Plus, allows users to engage visually within the conversation.
Expanding on this creative potential, OpenAI has introduced “Sora,” a cutting-edge video generation technique. Sora allows for the creation of high-quality, dynamic video content directly from text prompts, similar to how DALL-E works with images. This breakthrough technology opens new possibilities for storytelling, advertising, and digital content creation, enabling users to generate entire video sequences that match their textual descriptions. The ability to create video content with such ease and precision marks a significant leap forward in generative AI, pushing the boundaries of what is possible in multimedia production.
Infact about 90% of major Fortune 500 companies are using some flavour of chatGPT embedded or used in their application already. Google, Meta, Nvidia etc. have their own conversational assitants. In this race towards AI chatbots openAI has recently announced GPT-4 and later given developers freedom to create their own custom chatGPTs right from their playground website which can be shared, published and re-used, a marketplace for GPTs. The categories that have grown are so vast that it cannot be listed but this site captures, maintains and updates latest GPT based applications and use cases.
The engineers of the future , in a few keystrokes, fire up an instance of a four-quintillion-parameter model that already encodes the full extent of human knowledge (and then some), ready to be given any task required of the machine. The bulk of the intellectual work of getting the machine to do what one wants will be about coming up with the right examples, the right training data, and the right ways to evaluate the training process. Suitably powerful models capable of generalizing via few-shot learning will require only a few good examples of the task to be performed. Massive, human-curated datasets might no longer be necessary in most cases, and most people “training” an AI model will not be running gradient descent loops in PyTorch, or anything like it. They will be teaching by example, and the machine will do the rest.
Conclusion
This shift in the underlying definition of computing presents a huge opportunity, and this shift happened because of the huge data and being able to process them with the increasing computing power we have. We should accept the future of CS and evolve rather than knowing and doing nothing, this reminds me of the instances from the recent popular Netflix movie “Don’t Look Up!”
This blog has been written by Divyansh Sharma, working as a Software Development Engineer III at Sixt India.
References :
-
https://cacm.acm.org/magazines/2023/1/267976-the-end-of-programming/fulltext#R3
-
https://www.bricsys.com/blog/computer-programing-a-brief-history
-
https://en.wikipedia.org/wiki/History_of_artificial_neural_networks
-
Spring Reactive Programming: Asynchronous, Non-blocking, and Scalable Solutions
Before delving into reactive programming, it’s important to know the concept of a stream. A stream represents a sequence of data transmitted from one system to another, typically following a blocking, sequential, and FIFO (first-in-first-out) pattern. The conventional blocking nature of data streaming often hinders a system’s ability to process real-time data concurrently with streaming. Consequently, the concept of constructing a “reactive” systems architecture emerged to facilitate the seamless processing of data during streaming.
What is Reactive Programming and why is a need for Reactive Programming?
Reactive programming is a programming paradigm that helps to implement non-blocking, asynchronous, and event-driven or message-driven data processing. It models data and events as streams that it can observe and react to by processing or transforming the data. The term, “reactive,” refers to programming models that are built around reacting to changes. It is built around the publisher-subscriber pattern (observer pattern). In the reactive style of programming, we make a request for resources and start performing other things. When the data is available, we get the notification along with data in the callback function. The callback function handles the response as per application/user needs.
Most usual programs work in a way that if they’re busy, new tasks have to wait for their turn. This happens in traditional applications that use blocking or synchronous calls. When many threads are occupied, the program blocks new tasks until the ongoing ones are completed.
However, some modern applications need to handle multiple tasks at the same time. Reactive programming on the server side helps with this. It allows web or server applications to work more efficiently by handling multiple tasks simultaneously. This is done asynchronously, meaning the program doesn’t have to wait for one task to finish before starting another. This improves performance, makes the program more scalable, and better equipped to handle lots of users.
Difference between Blocking and Non-blocking request Processing.
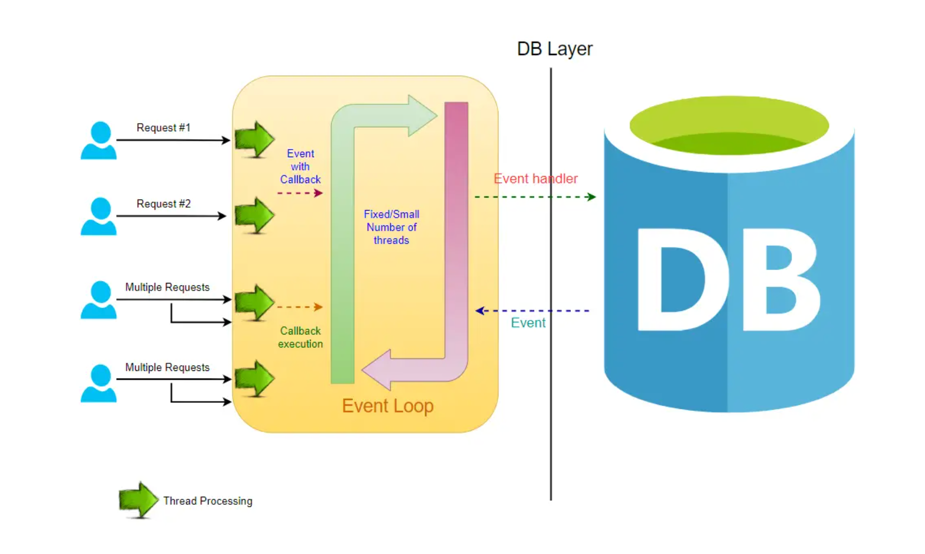
Blocking Request Model:
In a typical MVC application, when a request arrives at the server, a servlet thread is generated and assigned to worker threads for tasks such as I/O and database processing. While these worker threads are occupied with their tasks, the servlet threads go into a waiting state, causing the calls to be blocked. This process is known as blocking or synchronous request processing. Since a server has a finite number of request threads, it constrains the server’s ability to handle a maximum number of requests during peak loads. This limitation may impact performance and hinder the server from fully utilizing its capabilities.
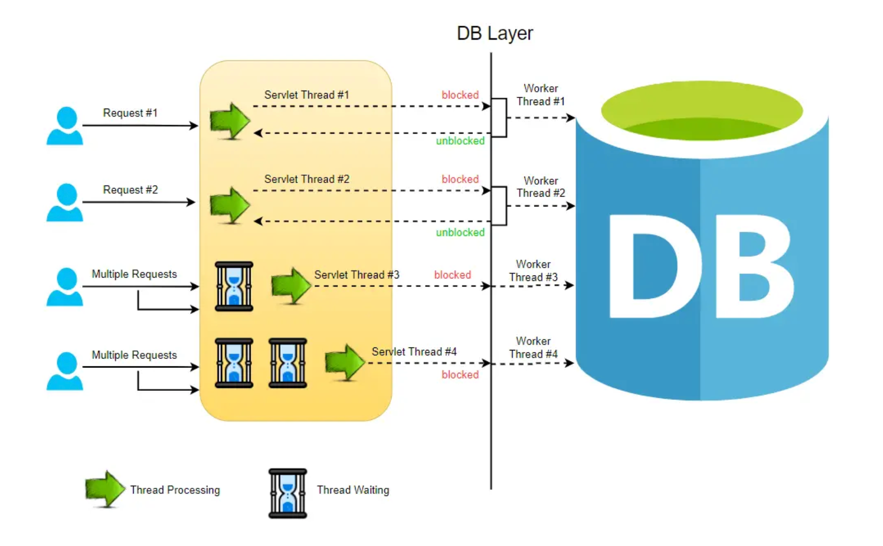
Non-blocking Request Model:
In a non-blocking system, every incoming request is accompanied by both an event handler and a callback. The request thread then delegates the incoming request to a thread pool, which efficiently manages a limited number of threads. Subsequently, the thread pool assigns the request to its handler function and becomes available to handle additional incoming requests from the request thread.
Upon completion of the handler function’s processing, one of the threads from the pool retrieves the response and forwards it to the callback function. Consequently, the threads in a non-blocking system never enter a waiting state, thereby enhancing the productivity and performance of the application.
In this non-blocking paradigm, a single request has the potential to be processed by multiple threads, contributing to the scalability of the application’s performance. The non-blocking nature of threads facilitates improved application performance, as the small number of threads leads to reduced memory utilization and minimizes context switching.
Components of Reactive Programming:
Reactive Streams was conceived with the aim of establishing a standard for asynchronous stream processing of data, incorporating non-blocking backpressure. To fulfill this objective, Java 9 introduced the Reactive Streams API.
- Publisher - It is responsible for preparing and transferring data to subscribers as individual messages. A Publisher can serve multiple subscribers but it has only one method, subscribe().
public interface Publisher<T> { public void subscribe(Subscriber<? super T> s); } - Subscriber - A Subscriber is responsible for receiving messages from a Publisher and processing those messages. It acts as a terminal operation in the Streams API. It has four methods to deal with the events received.
- onSubscribe(Subscription s) - Gets called automatically when a publisher registers itself and allows the subscription to request data.
- onNext(T t) - Gets called on the subscriber every time it is ready to receive a new message of generic type T.
- onError(Throwable t) - Is used to handle the next steps whenever an error is monitored.
- onComplete() - Allows to perform operations in case of successful subscription of data.
public interface Subscriber<T> { public void onSubscribe(Subscription s); public void onNext(T t); public void onError(Throwable t); public void onComplete(); } - Subscription: It represents a one to one relationship between the subscriber and publisher. It can be used only once by a single Subscriber. It has methods that allow requesting for data and to cancel the demand:
public interface Subscription { public void request(long n); public void cancel(); } - Processor: It represents a processing stage that consists of both Publisher and Subscriber.
    public interface Processor<T, R> extends Subscriber<T>, Publisher<R> {
     }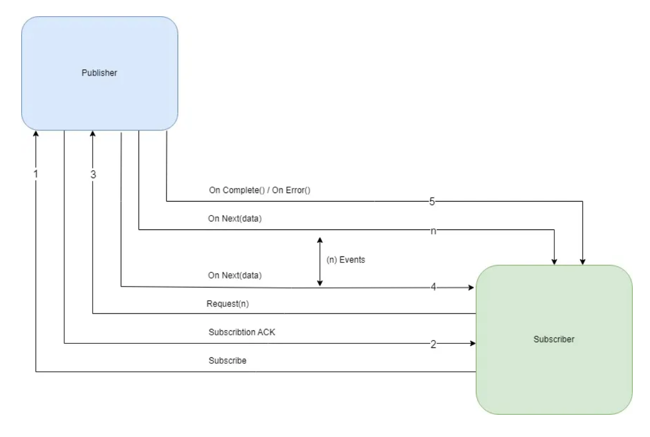
Spring Webflux
Spring WebFlux is a parallel version of Spring MVC and supports fully non-blocking reactive streams. It supports the back pressure concept and uses Netty as the inbuilt server to run reactive applications. It is built on Project Reactor library that makes it possible to build reactive applications on the HTTP layer.
Two publishers which are used heavily in webflux
- Mono: Returns 0 or 1 element.
Mono<String> mono = Mono.just("Sixt"); Mono<String> mono = Mono.empty(); - Flux: A Publisher that emits 0 to N elements which can keep emitting elements forever. It returns a sequence of elements and sends a notification when it has completed returning all its elements.
Flux<Integer> flux = Flux.just(1, 2, 3, 4);
Flux<String> fluxString = Flux.fromArray(new String[]{"A", "B", "C"});
Flux<String> fluxIterable = Flux.fromIterable(Arrays.asList("A", "B", "C"));
Flux<Integer> fluxRange = Flux.range(2, 5);
Flux<Long> fluxLong = Flux.interval(Duration.ofSeconds(10));

flux.subscribe();
The data won’t flow or be processed until the subscribe() method is called. log() method is used to trace and observe all the stream signals. The events are logged into the console.
To start with using Web Flux with spring boot below dependency should be added
   <dependency>
    <groupId>org.springframework.boot</groupId>
    <artifactId>spring-boot-starter-webflux</artifactId>
    <version>3.0.5</version>
   </dependency>
Concept of Backpressure:
In Reactive Streams, backpressure establishes the mechanism for regulating the transmission of data across streams.
Imagine that server A dispatches 1000 EPS (events per second) to server B. However, server B can only handle 800 EPS, resulting in a shortfall of 200 EPS. As a consequence, server B faces the challenge of falling behind, needing to process the deficit data and transmit it downstream or possibly store it in a database. Consequently, server B grapples with backpressure, and there’s a risk of running out of memory and experiencing failure.
To address this backpressure scenario, several options or strategies can be employed:
- Buffer - The deficit data can be buffered for later processing when the server has the capacity. But with a huge load of data coming in, this buffer might increase and the server would soon run out of memory.
- Drop - Dropping, i.e. not processing events, should be the last option. Usually, we can use the concept of data sampling combined with buffering to achieve less data loss.
- Control - The concept of controlling the producer that sends the data is by far the best option. Reactive Streams provides various options in both push and pull-based streams to control the data that is being produced and sent to the consumer.
Backpressure ensures that both producers and consumers can operate at their optimal processing rates, preventing bottlenecks or system overload.
   @GetMapping(produces = MediaType.TEXT_EVENT_STREAM_VALUE)
   public Flux<UserResponse> retrieveUsers() {
   return userService.retrieveUsers()
           .onBackpressureBuffer(10, BufferOverflowStrategy.DROP_OLDEST)
           .delayElements(Duration.ofMillis(100))
           .log();
}
The onBackpressureBuffer(10, BufferOverflowStrategy.DROP_OLDEST) operator is then applied to the Flux, which limits the buffer size to 10 elements and uses a buffer overflow strategy of dropping the oldest elements when the buffer becomes full. This means that if the downstream subscriber cannot keep up with the rate of emissions, the buffer will store up to 10 elements before it starts dropping older elements to make room for newer ones. The delayElements(Duration.ofMillis(100)) operator is applied to the Flux, which adds a delay of 100 milliseconds before emitting each element. This means that the UserResponse objects emitted by the Flux will be spaced out by at least 100 milliseconds, which can help control the rate of emissions and prevent backpressure issues.
One of the best examples of backpressure in a streaming service context is managing the flow of data between a content provider (such as Netflix) and a client (such as a user’s device) during video streaming. In video streaming, the server needs to send video data to the client continuously to maintain uninterrupted playback. However, the client’s ability to receive and process this data can vary due to factors like network congestion, device capabilities, or the user’s internet connection. Benefits:
Smooth Playback: By employing backpressure mechanisms, Netflix ensures smooth playback for users by dynamically adjusting the delivery of data based on network conditions and device capabilities.
Efficient Resource Utilization: Backpressure helps Netflix optimize the utilization of its streaming infrastructure, preventing overload on servers, CDNs, and network components.
Improved User Experience: By mitigating buffering and playback issues, backpressure contributes to a better overall user experience, leading to higher customer satisfaction and retention.
Use cases of Reactive Programming
Reactive web programming is particularly useful for applications that involve streaming data and real-time interactions. It uses methods that don’t block the program, making it responsive to changes without delay.
-
High-Concurrency Web Applications: Applications that require handling a large number of concurrent connections, such as real-time messaging systems, chat applications, or multiplayer online games, can benefit from Spring WebFlux. It allows handling many requests with a small number of threads, leading to efficient resource utilization and scalability.
-
Streaming Data and Media: Applications that deal with streaming data, such as audio/video streaming platforms, real-time analytics, or IoT data processing, can leverage Spring WebFlux. It supports handling continuous streams of data with backpressure mechanisms, ensuring that data processing is efficient and responsive.
-
Event-Driven Applications: Applications that are event-driven, where actions are triggered based on events or messages, can utilize Spring WebFlux to handle event streams efficiently. This includes applications like real-time notifications, event sourcing systems, or reactive workflows where responsiveness and real-time processing are critical.
-
Internet of Things (IoT) and Edge Computing: In IoT scenarios where devices generate continuous streams of data, and in edge computing environments where resources are limited, Spring WebFlux can be used to build reactive applications that handle data streams efficiently and can scale based on demand.
Limitations of Reactive Programming
- Complexity:
- Learning Curve: Reactive programming introduces new paradigms and abstractions, which can be challenging for developers accustomed to imperative programming.
- Debugging and Tracing: Reactive code can be harder to debug and trace due to its asynchronous nature, making it difficult to pinpoint the source of issues.
- Tooling and Ecosystem:
- Limited Tool Support: Compared to traditional Spring MVC, tooling and ecosystem support for WebFlux is less mature, which might limit debugging, profiling, and performance tuning capabilities.
- Integration Challenges: Integrating WebFlux with other libraries or frameworks that are not designed for reactive programming can be challenging.
- Limited Use Cases:
- Not Always Beneficial: For applications with low concurrency requirements or that are primarily CPU-bound, the benefits of a reactive model may not justify the added complexity.
- Suitability: Reactive programming is particularly beneficial for I/O-bound applications. For other types of applications, the traditional blocking model might be more straightforward and efficient.
- Library and Framework Compatibility:
- Blocking Libraries: Many existing Java libraries are blocking and may not work well with WebFlux, requiring careful selection or modification of libraries.
- Backpressure Handling: Properly handling backpressure (the situation where producers generate data faster than consumers can process) requires careful design and is not always straightforward.
- Scalability Concerns:
- Thread Pool Management: Managing thread pools effectively in a reactive system is crucial and can be complex. Poorly managed thread pools can negate the scalability benefits of a non-blocking approach.
- Resource Management: Reactive applications need careful resource management to avoid potential bottlenecks and ensure optimal performance.
While WebFlux offers significant advantages for building scalable, non-blocking applications, it is essential to weigh these disadvantages and consider whether it is the right fit for your specific use case and team expertise.
Conclusion
Reactivity and non-blocking behavior typically don’t enhance the speed of applications directly. Instead, the anticipated advantage lies in the capacity to scale the application efficiently using a limited, constant number of threads and reduced memory demands. This scalability feature contributes to enhanced resilience under heavy loads, ensuring a more predictable scaling pattern for applications.
read more- Publisher - It is responsible for preparing and transferring data to subscribers as individual messages. A Publisher can serve multiple subscribers but it has only one method, subscribe().
Dask: A parallel data processing python library for large datasets
While conducting data analytics, we often utilize Pandas to perform specific operations on the data in order to extract valuable insights. Initially, when working on data manipulation, I approached it as a data structure problem and did not make use of any built-in Pandas functions. Later, as I delved deeper into Pandas and explored its functions, I discovered that it was significantly faster than manually iterating over the DataFrame (or using the Pandas apply function, which essentially involves iterating over an axis and applying a function) and performing operations on individual rows. Curious about why these built-in functions were faster, I conducted some research and found that Pandas uses NumPy under the hood, which contributes to its speed. When can convert our dataframe to numpy vectors and perform mathematical operations on these vectors if we want our code to be fast. Writing code to perform these vector calculations is significantly harder when lots of operations are involved and sometimes python functions are easier and faster to implement.
In a specific use case involving a DataFrame was large, I had to iterate over the DataFrame and perform operations. This significantly slowed down my code. Recognizing the need for optimization, I began exploring ways to make the iteration (or the apply function) faster. While numerous alternatives were available, one of them was notably simple and easy to use and understand: a library called Dask. Dask parallelizes the process by breaking down the DataFrame into multiple partitions and performing operations on them concurrently.
read moreEmpowering Scalability: Harnessing the Power of CQRS for High-Performance Systems
In the world of software architecture and design patterns, the Command Query Responsibility Segregation (CQRS) pattern has gained popularity for its ability to improve system scalability, maintainability, and performance.
In this blog, we will explore what CQRS is, why it is essential, how to implement it, and the advantages it offers to developers and organizations.
read moreElevating Your Codebase: An Imperative Role of Alerting and Monitoring

In the world of software development, where every second counts and user expectations soar, the importance of robust alerting and monitoring within your application or service cannot be overstated. In this blog post, we’ll delve into the critical role these practices play in ensuring the reliability and performance of your applications or services. Furthermore, we’ll explore strategies to improve and standardize alerting and monitoring standards across development teams.
The Crucial Role of Alerting and Monitoring:
Alerting and Monitoring serve as the vigilant guardians of your application or service. These practices provide real-time insights into your application’s health, performance, and security. Without them, you’re navigating in the dark, leaving your systems vulnerable to outages and inefficiencies.
Proactive Issue Mitigation:
Effective alerting and monitoring systems allow you to catch issues before they escalate. Setting up alerts based on predefined thresholds enables proactive intervention. For example, if your server’s CPU usage exceeds 90%, an alert can trigger a notification, prompting immediate action. This level of proactive monitoring can significantly reduce downtime and service disruptions.
Vital Steps to follow when configuring Alerting and Monitoring Systems:
When setting up an alerting and monitoring mechanism in a application or service, it’s essential to consider the below steps to ensure that you choose the right metrics to effectively monitor your system.

- Data Collection and Storage:
- Data collection involves gathering data from various sources within your codebase or infrastructure. This data can include system performance metrics, application-specific metrics, logs, and more.
- Use appropriate data collectors and agents to retrieve and send this data to a central repository or monitoring system.
- Once data is collected, it needs to be stored and processed effectively. Data storage solutions like databases or time-series databases are used to store historical data.
- Carefully select the metrics ensuring that they are relevant to your application’s performance and business goals.
- Data Visualisation:
- Data visualization is about presenting the collected data in a human-readable format. It helps you understand the system’s behavior, trends, and anomalies.
- Use visualization tools like Grafana, Kibana, Splunk, Dynatrace, New Relic, and more to create charts, graphs, and reports that display metrics over time.
- Visualisation mainly aids in identifying patterns, and bottlenecks, allowing you to make data-driven decisions.
- Alerting and Notification:
- Alerting is a critical step that involves setting up rules and thresholds to trigger notifications when specific conditions or anomalies are detected.
- Notification mechanisms such as email, SMS, or integrations with tools like Slack, Opsgenie, PagerDuty, or incident management platforms are used to inform relevant parties when alerts are triggered.
- Monitoring:
- Monitoring is the continuous observation of your system’s performance and the responsiveness of your alerting system.
- Regularly review and refine the metrics, thresholds, and alerting rules to ensure they remain relevant and effective.
- Use monitoring to proactively detect and respond to issues, reduce downtime and improve system reliability.
Metrics relevant to application goals, Latency metrics, Error Rates based metrics, Scaling metrics to monitor resource utilization (CPU, memory, network, etc.), and Custom Metrics that address application-specific requirements must be key considerations when selecting appropriate metrics for alerting and monitoring.
Standardizing Alerting Practices:
To improve alerting standards across your application or service, consider the following steps:
- Define clear Objectives: Begin by establishing clear objectives for each alert. Define what constitutes a critical issue and what is merely informational. This clarity helps avoid alert fatigue.
- Thresholds and Conditions: Always define precise thresholds and conditions for triggering alerts. Make these thresholds data-driven, relying on historical performance data or observed patterns in metrics over time to set realistic and actionable alerts.
- Escalation Policies: Implement escalation policies to ensure that alerts are routed to the right teams or individuals based on severity levels and time sensitivity. Escalation policies help prevent alerts from getting lost in the noise.
Importance of Automation and Self-Healing in Streamlining Monitoring practices:
In the realm of monitoring, automation involves the deployment of tools and scripts that can carry out routine monitoring tasks, data collection, analysis, and responses to certain events or alerts. Automated processes can help improve efficiency, reduce manual errors, and ensure consistent and timely monitoring across various components of the IT environment.
Self-Healing, on the other hand, involves creating systems or processes that can automatically detect and respond to certain issues without requiring human intervention. Self-healing mechanisms aim to identify common problems and implement predefined solutions to restore or improve system functionality.
Key Reasons highlighting importance of Automation and Self-healing:
- Efficiency and Speed: Automation allows for the rapid execution of monitoring tasks, while self-healing systems can automatically resolve common issues which minimizes downtime and increases overall system efficiency.
- Scalability: The large scale of data can be overwhelming for manual monitoring. Automation allows for scalability, ensuring that monitoring practices can adapt to the size and complexity of infrastructure.
- Cost Savings: By automating routine monitoring tasks and enabling self-healing mechanisms, organizations can reduce the need for a large, dedicated workforce to manage and respond to alerts which results in improved operational efficiency, reduced downtime, and prevention of financial losses by preventing issues.
- Focus on Innovation: By automating repetitive tasks, teams can focus on more strategic and innovative projects.
Security and Compliance:
Integrating security and compliance checks into your alerting and monitoring processes is paramount. Regularly monitor for security breaches, unusual activities, and compliance violations. This safeguards your application’s integrity and user data. The prerequisites for setting up security and compliance are defining clear policies, Continuous Compliance Monitoring, Incident Response Plan Integration, and Regular Training and Drills. For Example, these play a major role in scenarios like Unauthorized access attempts, Data Ex-filtration Attempts, Application Security Breaches, etc.
Continual Improvement:
The landscape of software development is ever-evolving. Continual improvement in these processes is essential for maintaining the health and security of software systems. It involves adapting to changing environments, optimizing resource usage, and aligning with evolving business objectives. By regularly enhancing incident response processes, identifying root causes, and integrating new technologies organizations can ensure early detection of issues and enhance the overall user experience. It also plays a critical role in addressing compliance requirements, fostering efficient collaboration between teams, and enabling proactive risk management. This approach establishes a dynamic and responsive monitoring system that evolves alongside the codebase, promoting resilience, reliability, and long-term success. One major example is to conduct post-incident reviews to learn from past issues and refine your practices.
Conclusion:
In the dynamic world of software development, alerting and monitoring are your silent sentinels, guarding your application or service against unforeseen threats and performance bottlenecks. By standardizing these practices you elevate the reliability and resilience of your applications, ensuring they meet the high expectations of modern users.
Remember, the road to improvement starts with a commitment to vigilance. Invest in robust alerting and monitoring practices, set clear objectives, and adapt as your application evolves. Your users will thank you for the reliability and performance you deliver, and your development teams will operate with greater confidence in the codebase they oversee.
In the end, it’s not just about code – it’s about the experience you create and the trust you build with your users. Alerting and Monitoring are your allies in delivering exceptional software experiences.
read more- Data Collection and Storage:
Jetpack Compose: A New Era of Android UI Design

Introduction
Creating user-friendly interfaces in Android app development has always been a tough task. But now, Google’s Jetpack Compose is here to change the game. It’s a new toolkit that makes designing Android UIs a whole lot easier. This explanation gives you the inside scoop and practical skills to make stunning user interfaces using code examples.
In the past, we relied on XML-based layouts for Android apps, which could get pretty complicated. But Jetpack Compose is different. It uses a declarative approach, meaning you tell it how you want your UI to look, and it takes care of the rest. This makes UI development simpler, more efficient, and better suited for the dynamic nature of modern Android apps. So, with Jetpack Compose, you can create beautiful and responsive user interfaces that truly connect with your users.
read moreMobile App Security Testing: Planning and Initiating Testing

In today’s digital age, for various purposes like travel, banking, shopping, socializing, entertainment, learning and many more, we rely on mobile apps. However, with the increased dependency on mobile apps, there is an equally growing concern about the security of these applications. A single breach to the application can lead to compromise of user data, financial loss, and this can damage the brand’s reputation. To mitigate these risks, it is essential to plan and execute thorough security testing for mobile applications. Based on my experience, outlined below are the best practices to be followed while planning and strategizing security testing of mobile applications.
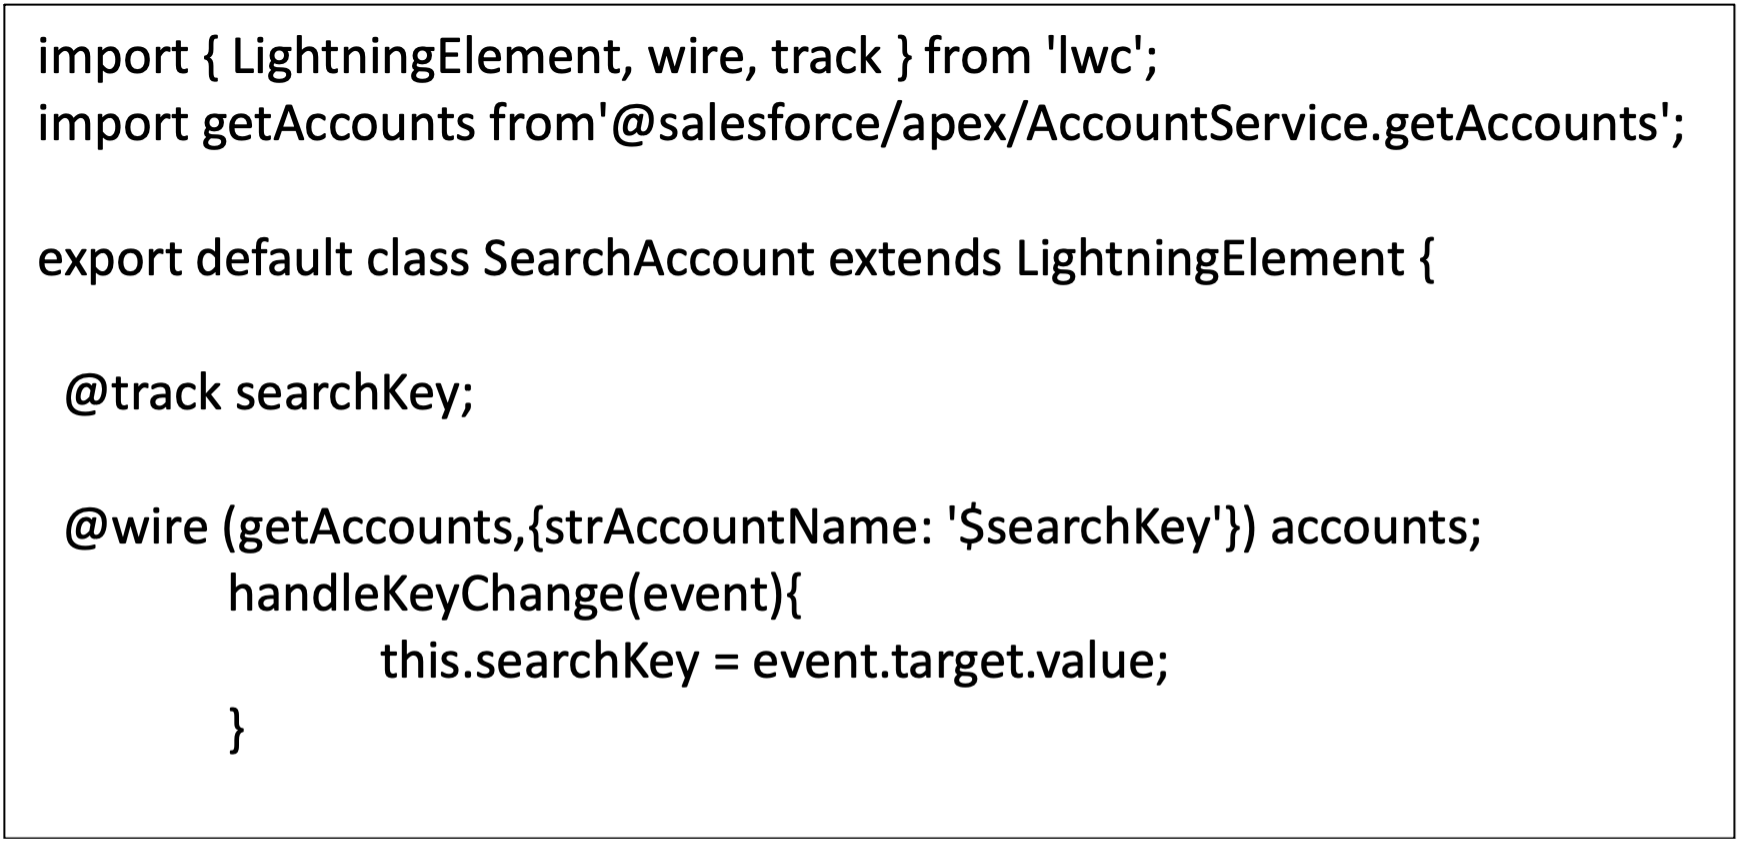
read moreStreamlining Service Calls in Salesforce Lightning Web Components (LWC)

Introduction:
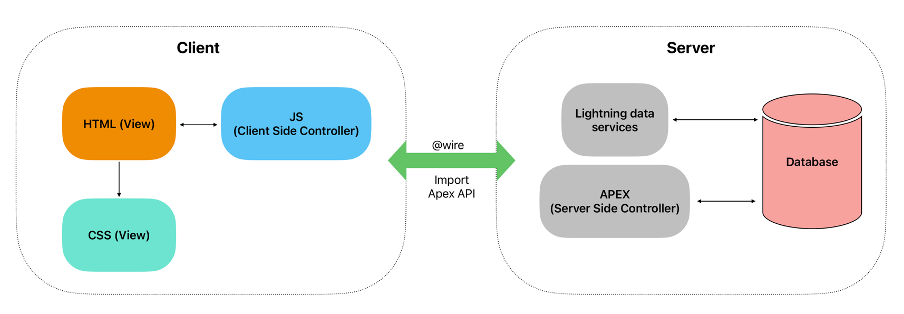
In the dynamic world of Salesforce development, delivering responsive and data-rich user interfaces is essential and is no longer just a necessity but a competitive advantage. Salesforce, a leader in the customer relationship management (CRM) industry, has continually pushed the envelope in developing tools that facilitate efficient customer service. One such tool that has gained significant traction is Lightning Web Components (LWC). Salesforce Lightning Web Components (LWC) empower developers to interact seamlessly with external services, fetching and displaying data with ease. In this comprehensive blog post, we will delve deep into the world of service calls within Salesforce LWC, exploring how it can transform your customer service operations.
## 1. The Importance of Service Calls in Salesforce Service calls are the lifeline of customer service in Salesforce. Service calls in Salesforce applications involve fetching or sending data to external sources, such as APIs or databases. Whether it’s retrieving customer information, updating records, or integrating with third-party systems, efficient service calls are crucial for a seamless user experience. Service calls can range from simple inquiries to complex problem-solving tasks. Managing them efficiently is pivotal for a seamless customer experience and streamlined business operations.
## 2. Challenges in Traditional Service Call Management
Before we dive into how Salesforce LWC can transform service calls, let’s take a moment to understand the challenges in traditional service call management:
• Disjointed Systems:
Many organizations rely on disparate systems for handling service calls, leading to inefficiencies, data silos, and inconsistencies in customer interactions.
• Manual Data Entry:
Traditional systems often require manual data entry, leading to errors, delays, and reduced productivity.
• Limited Visibility:
Without a unified view of customer interactions and service histories, it becomes challenging to provide personalized and efficient support.
• Lack of Automation:
Automation is key to providing timely responses and routing service requests to the right agents or teams. Traditional systems often lack robust automation capabilities.
## 3. Enter Salesforce Lightning Web Components (LWC)
Salesforce LWC offers a revolutionary approach to solving these challenges and transforming service call management. Let’s explore how LWC can revolutionize service calls in Salesforce:
• Unified Interface for Service Calls:
LWC enables the creation of custom components that provide a unified interface for service calls. These components can be embedded in various Salesforce pages, allowing agents to access service call information seamlessly.
• Real-time Data Updates:
With LWC’s two-way data binding, any changes made to service call information are immediately reflected in the user interface and vice versa. This real-time synchronization ensures that agents always work with the most up-to-date information.
• Mobile-Optimized Service Calls:
In today’s mobile-driven world, Salesforce LWC ensures that service call information is accessible and responsive on a wide range of devices. Field agents and support staff can access and update service call details while on the go, improving productivity.
• Integration with External Systems:
Many service calls require integration with external systems or APIs for tasks such as location-based services, inventory management, or order tracking. LWC simplifies these integrations, making it easier to provide comprehensive support to customers.
• Customization and Automation:
Salesforce LWC allows for the creation of custom automation rules and workflows. For instance, you can automate the assignment of service calls based on predefined criteria, prioritize urgent issues, or even trigger follow-up actions after a service call is closed.
## 4. Implementing Service Calls with Salesforce LWC
Now, let’s explore how to implement service calls effectively using Salesforce LWC:
• Create Custom LWC Components:
Start by designing and building custom LWC components that represent different aspects of service calls, such as customer details, service history, and issue resolution forms.
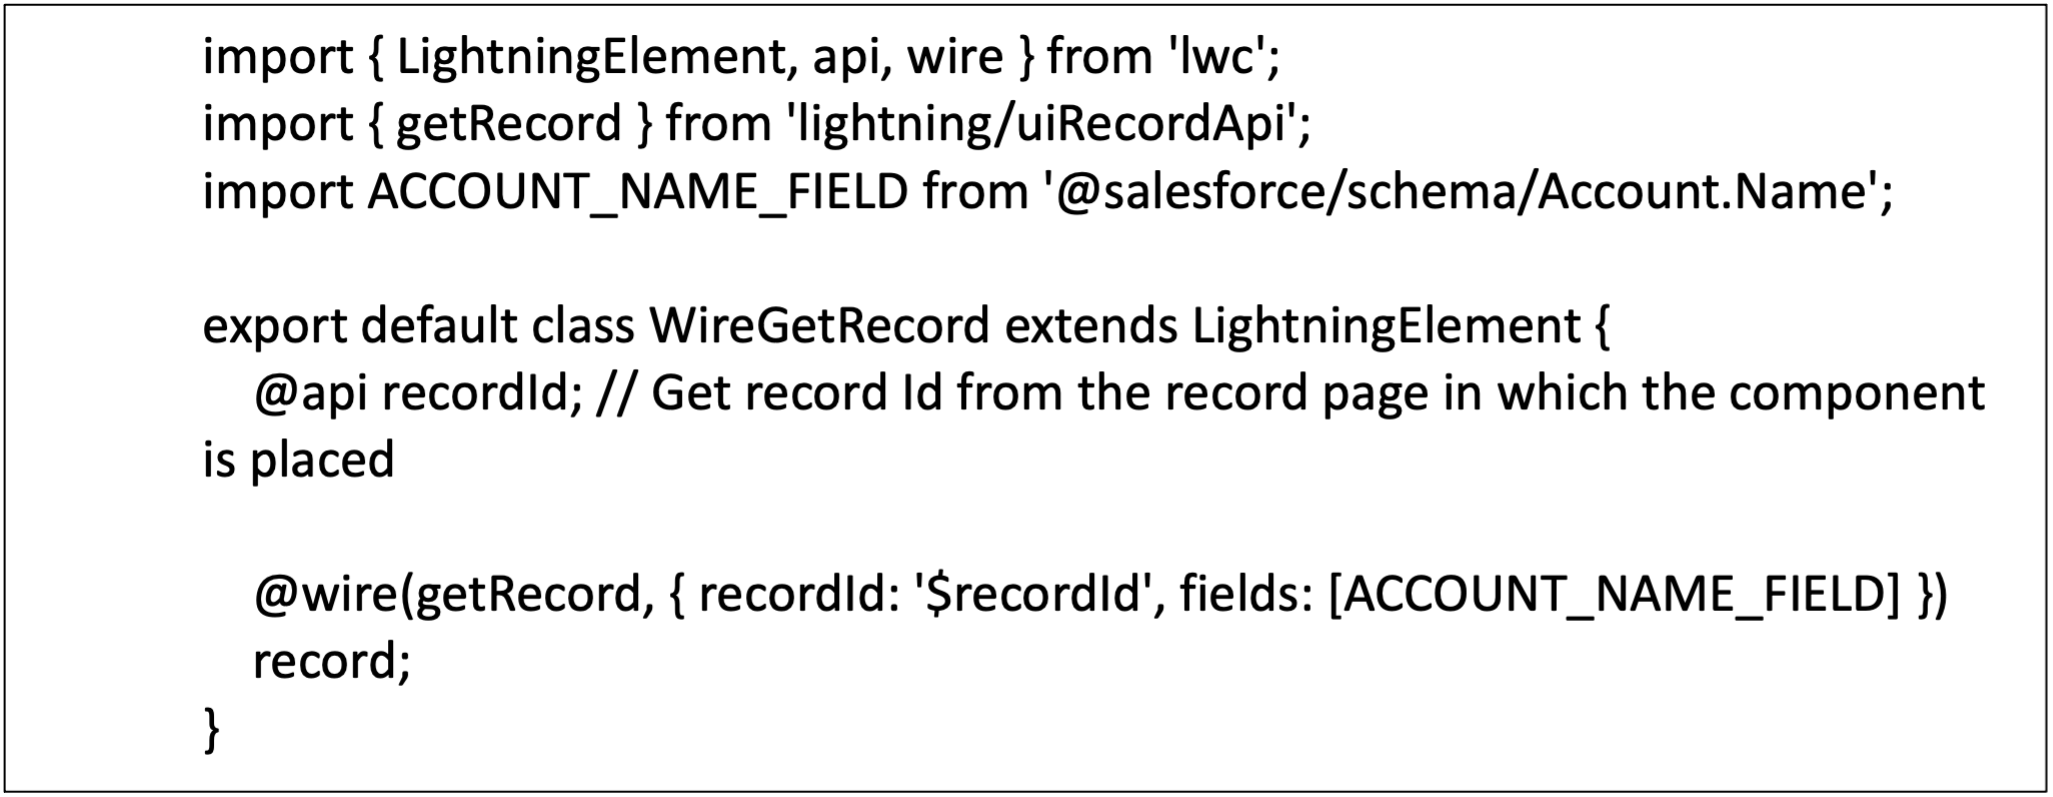
• Utilize Lightning Data Service (LDS):
LDS simplifies data retrieval, caching, and synchronization. It handles data access permissions and ensures that agents always work with the most accurate and up-to-date information.
• Integrate with Apex Controllers:
For more complex business logic or extensive data manipulation, integrate your LWC components with Apex controllers. Apex controllers allow you to execute server-side operations, validate data, and implement complex business rules.
• Implement Asynchronous Operations:
In scenarios where service calls involve time-consuming tasks, consider implementing asynchronous operations. This prevents the user interface from freezing and provides a responsive user experience.
## PROS
- LDS supports sharing rules and field level security.
- Record loaded by LDS is cached and shared across all components.
- Minimize XMLHttpRequests.
- After record changes, notification process is available. You can compare with publish-subscriber model.
- It is offline supported.
## CONS
- LDS is applicable to operate on a particular or single record at once. LDS is not supported for multiple records at once.
- LDS is only applicable in Lightning Experience. It is not supported in Lightning Components calling from Visualforce page or Lightning Out. If this Visualforce Page is added into Lightning Experience or in Salesforce Mobile app, then LDS is supported.
## 5. Conclusion: Elevating Customer Service with Salesforce LWC
In a world where customer service can make or break a business, Salesforce LWC emerges as a game-changer. It empowers organizations to streamline service calls, enhance the customer experience, and boost productivity. By creating custom components, leveraging real-time data updates, optimizing for mobile devices, integrating external systems, and automating workflows, Salesforce LWC transforms service call management into a dynamic, efficient, and customer-centric process.
As businesses continue to evolve, those who harness the potential of Salesforce LWC for service calls will find themselves at the forefront of providing exceptional customer service and staying ahead of the competition. The time to embark on this transformative journey is now, and Salesforce LWC is your trusted guide.
read moreStreamlining Salesforce Data Upload with SFDX in Git and Jenkins Workflow

Introduction:
In Salesforce development, deploying components from one org to another is a common practice. However, the standard deployment process often overlooks the need for data uploads or data synchronization between orgs. This blog post presents a robust solution that seamlessly integrates data loading into your deployment pipeline using Git, Jenkins, and the Salesforce CLI (SFDX) command. By automating data upserts, you can reduce manual effort, enhance deployment efficiency, and ensure consistent data across orgs.
Prerequisites :
Before implementing the data upload solution, make sure you have the following prerequisites in place:
## 1.Understanding Salesforce Data Bulk Upsert and SFDX:
Salesforce Data Bulk Upsert is a mechanism for inserting or updating records in Salesforce based on a unique identifier field. It is particularly useful when working with large datasets and allows you to efficiently perform operations on thousands or even millions of records. SFDX (Salesforce CLI) is a command-line interface tool that provides a unified experience for managing Salesforce applications and metadata.## 2.Setting Up Git and Jenkins for Salesforce Data Bulk Upsert:
Before diving into the data bulk upsert process, ensure that you have set up Git and Jenkins for your Salesforce project. This includes creating a Github repository to host your project and configuring Jenkins to automate various deployment tasks.## 3.Install Salesforce CLI on Jenkins Server:
Install Salesforce CLI on the machine where Jenkins is running. The installation instructions vary depending on the operating system of the server. You can find the official installation guide on the Salesforce CLI documentation page.## 4.Preparing the Data for Bulk Upsert:
To perform a data bulk upsert in Salesforce, you need to prepare the data in a suitable format. SFDX supports CSV (Comma-Separated Values) files for data import. Create a CSV file containing the records you want to insert or update, ensuring that it includes a unique identifier field that matches an existing field in your Salesforce object.## 5.Configuring the SFDX Data Bulk Upsert Command:
        The SFDX CLI provides a data command that enables you to perform bulk data operations. To configure the data bulk upsert command, follow these steps:

        1.Open a command prompt or terminal and navigate to your Salesforce project directory.
        2.Authenticate with your Salesforce org using the SFDX CLI.
        3.Use the following command to perform the data bulk upsert:

            sfdx force:data:bulk:upsert -s <ObjectAPIName> -f <CSVFilePath> -i <ExternalIdFieldAPIName> **

    Replace <ObjectAPIName> with the API name of the Salesforce object,

            <CSVFilePath> with the path to your CSV file,

            <ExternalIdFieldAPIName> with the API name of the unique identifier field.
Integrating SFDX Data Bulk Upsert with Git and Jenkins:
Now that you have configured the SFDX data bulk upsert command, it’s time to integrate it into your Git and Jenkins workflow:
Lets us consider the workflow as shown below,
  where stage branch is authenticated with Salesforce stage org,

        master branch with Salesforce production and

        feature branch is created and merged with stage and then to the Master with every data upload / deployment task.
## 1. Update the Jenkile file:
   On your Master and Stage branch,Navigate to your Jenkins file  and  include a build step to execute the SFDX data bulk upsert command.

    stage('Data Push to stage') {
       when { expression { return env.BRANCH_NAME == ('stage') }}
        steps {
            script {
             sh '''
                set +x
                echo "${replace_SFDX_server_stage_key}" > ./server.key
     '''
                sh "sfdx force:auth:jwt:grant --clientid ${consumer_key} --username ${replace_user_name} --jwtkeyfile './server.key' --instanceurl ${replace_sfdc_host_sandbox} --setdefaultusername"
                def packageFilePath = 'zen_booking/zen_package_booking_stage.csv'

                //GET THE FILES CHANGED AS PART OF MERGE REQUEST

                def commitHash = sh(returnStdout: true, script: 'git rev-parse HEAD').trim()
                def diffCmd = "git diff --name-only ${commitHash} ${commitHash}~1"
                def changedFiles = sh(returnStdout: true, script: diffCmd).trim().split('\n')

                echo "Changes ${changedFiles} in PR"
                //PERFORM DATA LOAD ONLY IF THE FILE HAS BE ALTERED
                if (changedFiles.contains(packageFilePath)) {
                    echo "*****************Data Load Started!****************"
                    def result = sh script: 'sfdx force:data:bulk:upsert -s Custom_Object__c -f ./foldername/file_name.csv -i External_Id__c --serial', returnStdout: true
                        echo "$result"
                          def jobIdPattern = Pattern.compile(/-i\s+(\S+)/)
                          def batchIdPattern = Pattern.compile(/-b\s+(\S+)/)

                    def jobIdMatcher = jobIdPattern.matcher(result)
                    def batchIdMatcher = batchIdPattern.matcher(result)

                    def jobId = jobIdMatcher.find() ? jobIdMatcher.group(1) : null
                    def batchId = batchIdMatcher.find() ? batchIdMatcher.group(1) : null

                        sleep(time: 30, unit: 'SECONDS')

                   // Set the Salesforce CLI command with the dynamic Job ID and Batch ID
                      def sfdxCommand = "sfdx force:data:bulk:status -i $jobId -b $batchId"
                  // Execute the command
                  def response = sh(returnStdout: true, script: sfdxCommand)
                  echo "****************Getting the response for the Data Load*************: $response"
                }

            }
        }
    }

      Note: Replace Custom_Object__c - with the relevant object API ,

            foldername/file_name.csv - with the relevant folder name and the file name where the changes are added,

            External_Id__c - External Id field to perform the data upsert

            Similary add a stage script for Master.
## 2. Clone a feature branch and add csv for data upload:
Clone a feature branch from the Master and add the folder( same as the foldername as mentioned in the above step) and add the required csv files inside the folder (use the same file_names.csv) and Commit the CSV files containing the data## 3.Monitoring the success and failure logs:
After merging the changes from the Feature Branch to Stage/Master, the next step is to verify the data load status in the Jenkins job. Keep an eye on the printed $response message to ensure everything is running smoothly. In case any failures occur during the data load, don't worry! You can quickly navigate to "monitor bulk upload jobs" in the corresponding Salesforce org to find out the reason for the failure.Advantages:
Using SFDX Bulk Data Upsert from a Jenkins script offers several advantages for your Salesforce data management workflows:
## 1. Automation and CI/CD Integration:
By incorporating SFDX Bulk Data Upsert into a Jenkins script, you can automate data loading processes as part of your Continuous Integration/Continuous Deployment (CI/CD) pipeline. This ensures consistent and automated data updates during application development and deployment.## 2. Efficient Data Loading:
Bulk Data Upsert leverages Salesforce Bulk API, which is optimized for processing large volumes of data. With Jenkins, you can schedule and execute data upserts at specific times, enabling efficient data loading without manual intervention.## 3. Reduced API Usage:
SFDX Bulk Data Upsert consumes fewer API calls compared to traditional data loading methods. This helps you stay within Salesforce API limits and avoid unnecessary API costs.## 4. Scalability and Performance:
Jenkins allows you to scale data loading processes horizontally by adding more build agents or nodes. This ensures fast and efficient data upserts, even for massive datasets.## 5. Error Handling and Reporting:
Jenkins provides excellent error handling and reporting capabilities. You can set up notifications and alerts to monitor the data upsert process and quickly respond to any issues that may arise.## 6. Security and Access Control:
Jenkins offers robust security features, allowing you to control access to data loading scripts and credentials. You can implement secure authentication methods to protect sensitive data.## 7. Consistency and Reproducibility:
Jenkins ensures that data upserts are executed consistently every time they are triggered. This guarantees reproducibility and eliminates human errors in data loading.## 8.Scheduling Flexibility:
With Jenkins, you can schedule data upserts to run at specific intervals, during off-peak hours, or based on triggers like code commits or other events. This enhances flexibility and optimization of data loading processes.In summary, leveraging SFDX Bulk Data Upsert from a Jenkins script offers numerous benefits, including automation, scalability, reduced API usage, error handling, security, and seamless integration with other tools. It simplifies and streamlines your Salesforce data loading workflows while ensuring consistency and efficiency in data management.
read moreJava Virtual Threads vs Platform Threads Performance Comparison under high load.

Platform Thread vs Java Thread.
Before we begin comparing the performance of virtual threads to platform threads we need to understand the key differences between them. Java’s platform thread is just a wrapper over the OS thread. Since OS threads are managed via the underlying operating system, their scheduling and optimisations are practically inaccessible to JVM. This is where virtual threads comes into action, part of project loom JEP425 virtual threads provide a one-to-one mapping over the underlying OS threads. In this case JVM is responsible to mapping virtual threads to OS threads, and in scenarios where Java App is busy in a non CPU bound task such as Network call or a DB call. JVM can just un-map that thread corresponding to non CPU bound task and free up that OS thread as well, there by allowing full control over scheduling optimisations.
read moreElevating Code Quality and Speed: Exploring BDD with TDD for Effective software development
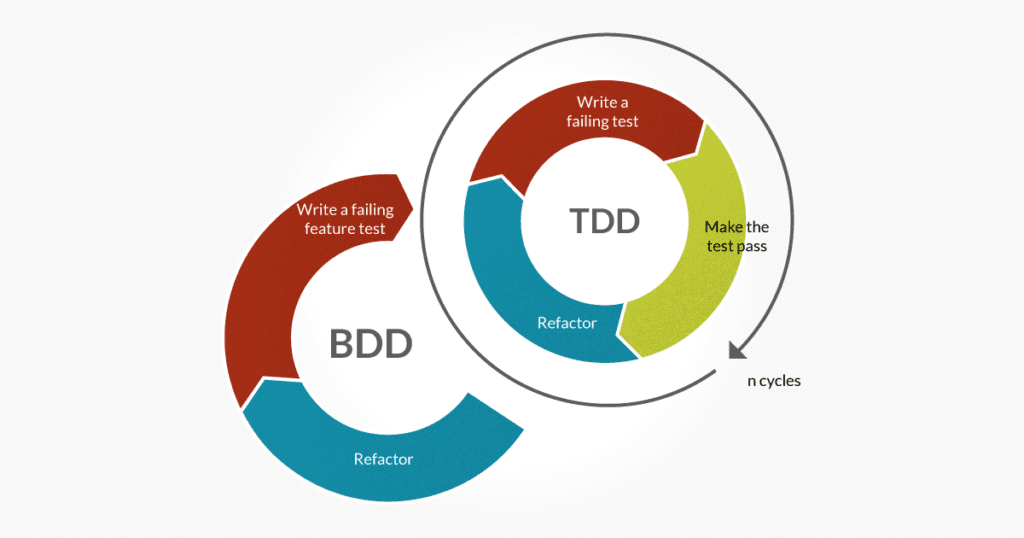
In the fast-paced world of software development we live in today, it’s always a challenge to deliver top-notch applications quickly and efficiently. Thorough testing is an essential part of the development process to achieve that. By combining Behaviour-Driven Development (BDD) with Test-Driven Development (TDD), we can enhance the effectiveness of the testing process and ultimately improve the overall quality of our software.
In this blog , we will dive into the world of BDD and TDD, exploring their fundamental principles, benefits, and practical implementation techniques
read moreBug Bashing: A Fun and Effective Way to Improve Software Quality

What is Bug Bash?:
A bug bash is a collaborative effort aimed at uncovering a large number of bugs within a short time interval. During a bug bash, various participants beyond testers, such as developers, product managers, engineering managers, designers, marketers, solution engineers, writers, customer support representatives, and even executives like the CTO and CEO, can also join in.
read moreKey Metrics to Assess the Effectiveness of Automation Testing

Introduction:
Automation testing plays a crucial role in ensuring the delivery of a high-quality product. While the significance of automation tests is widely acknowledged, it is important to determine how to quantify their impact, assess their value in terms of effort and resources, and measure the success of test automation. Outlined below are metrics that can be employed to evaluate the effect of automation on the overall application quality, along with some best practices to generate data for these metrics.
read moreImplementing dynamic filtering on joined queries using JPA specification and criteria API

Introduction:
In most web applications, we would have come across a requirement to filter, sort, and paginate the data by joining multiple tables. If you are using Spring JPA then there are multiple ways to retrieve and paginate the data on joined table.
- Writing native queries.
- Using JPQL query.
- Using inbuilt repository methods.
These options are good for the use case where we will have to construct the query based on a fixed set of conditions/where clauses. We can’t add where clause at runtime using these options.
Spring JPA also provides the capability to generate dynamic SQL queries with help of Criteria API and Specification. In this article, we will see how we can leverage JPA Criteria query support to build generic specifications which can retrieve rows from joins on multiple tables with sorting and pagination.
read morePerformance testing with Gatling

Measuring the performance of an application is critical to business expansion and growth. One of the ways to achieve this is through load and performance tests. Load Testing ensures that your application can perform as expected in production. Just because your application will pass a functional test, this does not mean that it can perform the same under a load. Load testing identifies where and when your application breaks, so you can fix the issue before shipping to production.
What is load testing?
Load testing is a mechanism which helps us to identify the performance bottleneck in a website and take corrective measures which brings in a positive user experience. Be it a micro-service, a REST service or a website, load testing can help to identify the culprit bringing down the performance of the application and give an indication of optimal resources required to run smoothly.
read moreUnraveling Patterns: Exploring the Fascinating World of Clustering Algorithms
Clustering is a popular technique in machine learning used for grouping data points based on their similarities. It is a type of unsupervised learning method where there is no predefined output variable or label. Instead, the algorithm attempts to discover patterns and structure within the data by grouping similar data points.
read moreIntroduction To Object Relational Mapping in Java
Programmers using object-oriented programming languages often struggle with integrating the database structure with their code because relational databases use tables to represent data, while object-oriented languages like Java use connected objects.
OOP developers also face the challenge of connecting their application to a relational database using structured query language (SQL), which can be time-consuming and require understanding of raw SQL coding. SQL query builders provide a layer of abstraction that helps to simplify the process and provide more information about the data.
Object-Relational Mapping (ORM) is a programming technique that enables software developers to work with object-oriented programming languages, such as Java, Python, or Ruby, to interact with relational databases, such as MySQL, Oracle, or Microsoft SQL Server.
ORM is an abstraction layer that helps to bridge the gap between the object-oriented programming paradigm and the relational database model. It allows developers to use objects to represent database entities, such as tables, rows, and columns, and to manipulate them more naturally and intuitively.
read moreEfficient Data Management in React with React Query

React Query is a lightweight library for fetching, caching, and updating asynchronous data in React applications. It is designed to work with a variety of data sources, including REST APIs and GraphQL endpoints.
It is used for managing, caching, and synchronizing asynchronous data in React applications. It makes it easy to work with asynchronous data and API requests in React.
read moreExploring React 19: New Features and Enhancements

Exploring React 19: New Features and Enhancements
React 19 brings several exciting updates designed to simplify development, enhance performance, and improve user experience. In this blog, we’ll explore these new features, focusing on improvements in form handling, powerful hooks, enhanced Suspense, and server components.
Table of Contents
Simplified Form Handling with Actions and New Hooks
Forms in React 19 have become more intuitive with actions and new hooks. These improvements make data mutations, loading states, error handling, and optimistic updates easier to manage.
🎬 Actions
React’s new actions feature revolutionizes form handling. Traditionally, we relied on the submit button in the form and also needed states to access the values of the inputs within the form to submit the data. Now, with the action attribute in the tag, data capture and submission become seamless.
Example:
function UpdateName() {
  const [name, setName] = useState('');
  const updateName = async (formData) => {
    const newName = formData.get('name');
    // Perform update operation
    return 'Update successful';
  };

  return (
    <form action={updateName}>
      <input
        name="name"
        value={name}
        onChange={(e) => setName(e.target.value)}
      />
      <button type="submit">Update Name</button>
    </form>
  );
}
In this example, the action attribute connects the form to the updateName function, handling data submission seamlessly without requiring additional state for form management.
⚡ useActionState
The useActionState hook helps manage the state of an action, including errors, results, and loading status. It streamlines handling side effects during data mutations by reducing the need for manual state management.
Example:
import React, { useState } from 'react';
import { useActionState } from 'react';

function UpdateName() {
  const [name, setName] = useState('');
  const [state, submitAction, isPending] = useActionState(async (formData) => {
    // Simulate an API request
    await fakeApiRequest(formData);
    return { success: true, message: 'Name updated!' };
  }, null);

  return (
    <div>
      <form action={submitAction}>
        <input
          type="text"
          name="name"
          value={name}
          onChange={(e) => setName(e.target.value)}
        />
        <button type="submit" disabled={isPending}>
          {isPending ? 'Updating...' : 'Update Name'}
        </button>
      </form>
      {state?.message && <p>{state.success ? 'Success!' : 'Failed!'}</p>}
    </div>
  );
}
The useActionState hook takes an action function and an initial state as inputs, then returns:
-
state: Tracks the current status and results.
-
submitAction: A function to trigger the action.
-
isPending: Indicates whether the action is in progress.
This simplifies handling asynchronous form submissions with minimal boilerplate.
🔄 useFormStatus
The useFormStatus hook tracks if a form submission is pending. It especially helps update UI elements, like disabling the submit button, showing loaders, or displaying error messages during the submission.
Example:
import { useFormStatus } from 'react';
function SubmitButton() {
  const [pending] = useFormStatus();
  return (
    <button type="submit" disabled={pending}>
      {pending ? 'Submitting...' : 'Submit'}
    </button>
  );
}
In this example, the button’s text and disabled state dynamically reflect the form’s submission status, providing real-time feedback to users.
Note: The useFormStatus hook cannot be used in the same component as the form. It only works when monitoring the status of the form from a parent or separate component.
💡 useOptimistic
The useOptimistic simplifies handling optimistic updates. It lets the UI show changes instantly before server confirmation. If the action fails, the UI reverts to its original state, ensuring consistency.
Example:
import { useOptimistic } from 'react';

function UsernameForm({ currentName, setCurrentName }) {
  const [optimisticName, setOptimisticName] = useOptimistic(currentName);

  const handleChange = async (newName) => {
    setOptimisticName(newName);
    const updatedName = await updateName(newName);
    setCurrentName(updatedName);
  };

  return (
    <input
      value={optimisticName}
      onChange={(e) => handleChange(e.target.value)}
    />
  );
}
The useOptimistic hook initially shows the optimisticName, and once the updateName request is resolved, React automatically switches back to the confirmed currentName value.
🧩 New API: use
React 19 introduces the versatile use API, which simplifies handling asynchronous operations and reading context.
Use Cases:
-
Data Fetching: Replaces useEffect for handling async operations.
-
Context Reading: Access context values directly, without needing useContext.
-
Seamless Integration with Suspense: Works natively with Suspense for improved loading states.
Example:
import { use, Suspense } from 'react';
import ThemeContext from './ThemeContext';

function Person({ fetchPersonPromise }) {
  // Using 'use' to handle asynchronous operations
  const person = use(fetchPersonPromise());
  // Using 'use' to read context
  const theme = use(ThemeContext);

  return <h1 style=>{person.name}</h1>;
}

function Profile({ fetchPersonPromise }) {
  return (
    <Suspense fallback={<h1>Loading...</h1>}>
      <Person fetchPersonPromise={fetchPersonPromise} />
    </Suspense>
  );
}
In this example, the use API simplifies fetching data and accessing context, while Suspense handles loading states. The function passed to use must return a promise to allow React to manage the loading state with Suspense.
Note : Unlike other hooks, use can be called conditionally
🌀 Improvements to Suspense
React 19 enhances Suspense by rendering fallbacks immediately when a component is suspended, without waiting for sibling components to complete their rendering. This results in faster fallback displays and improved performance.
Previous Behavior:
-
Start fetch1
-
Start fetch2
-
Render fallback
Both fetch1 and fetch2 starts at the same time and then fallback renders afterwards.
New Behavior:
-
Start fetch1
-
Render fallback
-
Start fetch2
Fallback renders as soon as fetch1 starts. This ensures loading indicators appear quickly, improving user experience during data fetching.
🔗 Simplified Ref Handling
In React 19, passing refs as props no longer requires forwardRef. This simplification reduces boilerplate and makes code more readable.
Example:
function ChildComponent({ inputRef }) {
  return <input ref={inputRef} />;
}

function ParentComponent() {
  const inputRef = useRef(null);

  return <ChildComponent inputRef={inputRef} />;
}
🌐 React Server Components
React 19 introduces deeper integration of Server Components, enabling developers to seamlessly combine client-side and server-side rendering for improved performance. This architecture allows for faster initial loads by shifting heavy processing and data-fetching to the server while still allowing interactivity on the client.
React provides special directives to manage component execution context:
-
‘use client’: This directive is used when the logic should run on the client.
-
‘use server’: This directive is used for functions within a Server Component to ensure they are executed only on the server.
Note : The ‘use server’ directive is applied inside functions within a Server Component, not on the component itself.
Example of use server in a Server Component:
// MyServerComponent.server.js
'use server'; // This marks the function below as running only on the server
// Server-side function for fetching data
async function fetchDataFromServer() {
  const res = await fetch('https://api.example.com/data');
  return res.json();
}
export default function MyServerComponent() {
  const data = fetchDataFromServer(); // This function runs on the server
  return (
    <div>
      <h1>Server Component</h1>
      <pre>{JSON.stringify(data, null, 2)}</pre>
    </div>
  );
}
📦 Context as Provider:
There’s no need for anymore. You can use directly instead.
const ThemeContext = createContext('');

function App({ children }) {
  return <ThemeContext value="dark">{children}</ThemeContext>;
}
⚠️🔧 Better Error Reporting in React 19
React 19 brings significant improvements to error handling, making debugging easier and more efficient.
1. Duplicate Error Reporting Removal
Previously, React would throw the same error twice: once for the initial error, and again after failing to automatically recover. This could be confusing and cluttered the console. Now, React only reports the error once, simplifying the debugging process.
Before:
Error: Rendering failed!
    at BrokenComponent
    at App
Error: Uncaught error after React failed to recover
    at BrokenComponent
    at App
After:
Error: Rendering failed!
    at BrokenComponent
    at App
2. Improved Hydration Error Reporting
Hydration errors used to display multiple warnings, making it difficult to identify the root cause. React 19 now logs a single, more informative mismatch error, helping you fix issues faster.
Before:
Warning: Expected server HTML to contain a matching <button> element with attributes: {"disabled":true}.
Warning: Hydration failed and React will discard the server-rendered content.
After:
Warning: Hydration error - Attribute mismatch on <button> element.
    Server: {"disabled":true}
    Client: {}
Suggestion: Ensure the server-rendered attributes match the client component output.
React 19 simplifies development with new features like improved form handling, powerful hooks, enhanced Suspense, and better error reporting. These updates streamline state management, boost performance, and make debugging easier, enabling developers to build faster, more efficient apps.
Thanks for reading and Happy coding!
read moreWhat is Swagger, and how does it work?
In today’s software development world, the software development lifecycle depends on APIs. If you are a software developer, you must be integrating APIs into your application.
APIs (Application Programming Interfaces) allow us to expose the data and functionality to the public for use, and then we can add that data to the applications we build.
Swagger is one of the most popular tools for web developers to document REST APIs.
read moreMust Know Concepts of System Design

System design is the process of defining the architecture, interfaces, and data for a system that satisfies specific requirements. It requires a systematic approach and requires you to think about everything in infrastructure, from the hardware and software, all the way down to the data. These decisions are required to be taken carefully keeping in mind not only the Functional Requirements but also the NFRs Scalability, Reliability, Availability, and Maintainability.
read moreMocking with Mockery in Golang

Adding unit tests is paramount when it comes to ensuring the reliability and maintainability of the code written. It not only serves as a safety net to catch bugs early, but also safeguards future integrations. Pertaining to writing unit tests, mocking becomes an even more indispensable tool. Mocking facilitates isolation of specific components and emulating their behavior, creating controlled environments for testing without relying on external dependencies. We will be exploring how to create mocks using Mockery, a popular mocking library for Go.
What is Mockery?
Mockery is a tool that generates mock implementations of interfaces. Please do keep in mind that the interfaces need to be present, to be able to be mocked. Mockery heavily relies on interfaces to substitute real implementations with mocks. It enhances modularity, enables test isolation and facilitates dynamic behavior replacement during testing. We will understand more on this with the example mentioned later.
Github link can be found in Mockery.
Salient Features of Mockery
-
Automatic mock generation: Mockery automates the process of creating mock implementations for interfaces. You simply provide the interface you want to mock and Mockery generates the corresponding mock implementation. This can save a lot of time and effort, especially when dealing with interfaces that have numerous methods.
-
Simple command-line interface: Being a command-line tool, its usage is pretty straightforward. Just run a command with desired options, you will have your mocks generated. Not only that, we can customize various aspects too. We will understand further when we deep dive on the options/flags.
-
Support for testify/mock assertions: The generated mocks can easily be integrated with the assertions provided by the ‘testify/mock’ package, allowing us to seamlessly use ‘On’, ‘Return’, ‘AssertExpectations’ etc.
-
Mocking unexported interfaces: Mockery supports generation of mocks for unexported interfaces. This is quite useful when you have internal interfaces that you want to mock for testing purposes, but you don’t want to expose them to the external API of your package.
Getting started with Mockery
Before starting, we need to make sure to have Mockery installed. We can do it using below command :
go get github.com/vektra/mockery/v2/../Once installed, we can use Mockery to generate mocks for the interfaces.
Mockery Commands
1. Generate Mocks for All interfaces
To generate mocks for all interfaces in the current directory and its subdirectories
mockery --all2. Generate Mocks for a Specific interface
To generate mocks for a specific interface, we can use name flag
mockery --name InterfaceName3. Specify output directory
By default, Mockery generates mocks in the ./mocks directory. We can use output flag to specify different output directory.
mockery --all --output path/to/output4. Include subdirectories
Include subdirectories when generating mocks, we can use recursive flag.
mockery --all --recursive5. Specify package name
Use the keeptree flag to preserve the directory structure when generating mocks. This can be useful to maintain the same package structure in mocks directory.
mockery --all --keeptree6. Generate Mocks for a specific package
Create mocks for interfaces defined in a specific package. Handy in combination with output flag.
mockery --all --dir path/to/package7. Define Output Package Name
To set custom package name for the generated mocks, we can use outputpkg flag.
mockery --all --outputpkg customMocksExample: Using Mockery to test an interface
Let’s consider we have an interface DataProvider which represents an external service to fetch data. In our case, we will just return a random number between 0 and the number passed.
// data_provider.go
package service

// DataProvider is an interface for fetching and retrieving data.
type DataProvider interface {
	GetRandomNumber(id int) (int, error)
}
Let’s create the implementation of the interface DataProvider to return a random number.
// data_provider_impl.go
package service

import (
	"errors"
	"math/rand"
)

// DataProviderImpl is the concrete implementation of the DataProvider interface.
type DataProviderImpl struct{}

// GetRandomNumber simulates fetching a random number between 0 and id.
func (d *DataProviderImpl) GetRandomNumber(id int) (int, error) {
	if id < 0 {
		return 0, errors.New("Invalid id")
	}
	// Simulate fetching a random number between 0 and id
	return rand.Intn(id + 1), nil
}
Now, we need to consume the DataProvider to get the random data. Let’s create that. Additionally, we will check if the random number we fetched, is even or odd.
// data_consumer.go
package service

// ConsumeData is a function that uses a DataProvider to fetch and process data.
func ConsumeData(provider DataProvider, id int) (string, error) {
	// Use GetRandomNumber to get a random number between 0 and id
	randomNumber, err := provider.GetRandomNumber(id)
	if err != nil {
		return "", err
	}

	// Check whether the value is even or odd
	result := checkEvenOrOdd(randomNumber)

	// Return the result
	return result, nil
}

// checkEvenOrOdd checks whether the given value is even or odd.
func checkEvenOrOdd(value int) string {
	if value % 2 == 0 {
		return "Even"
	}
	return "Odd"
}
Now, let’s create the mocks for DataProvider interface using Mockery. We will use below command to do so.
mockery --output ./mocks --dir ./service --allOn running the command, you will see below execution. What this will do, is create a DataProvider.go inside mocks package since we have specified –output ./mocks in the mockery command.
22 Jan 24 08:33 IST INF Starting mockery dry-run=false version=v2.36.1
22 Jan 24 08:33 IST INF Using config:  dry-run=false version=v2.36.1
22 Jan 24 08:33 IST INF Walking dry-run=false version=v2.36.1
22 Jan 24 08:33 IST INF Generating mock dry-run=false interface=DataProvider qualified-name=RandomizedEvenOdd/service version=v2.36.1
22 Jan 24 08:33 IST INF writing mock to file dry-run=false interface=DataProvider qualified-name=RandomizedEvenOdd/service version=v2.36.1
Auto generated mocked DataProvider.go will be like below. Please make sure to re-generate mocks whenever there is an update in the interfaces. For example, we add a new function in the interface.
// Code generated by mockery v2.36.1. DO NOT EDIT.

package mocks

import mock "github.com/stretchr/testify/mock"

// DataProvider is an autogenerated mock type for the DataProvider type
type DataProvider struct {
	mock.Mock
}

// GetRandomNumber provides a mock function with given fields: id
func (_m *DataProvider) GetRandomNumber(id int) (int, error) {
	ret := _m.Called(id)

	var r0 int
	var r1 error
	if rf, ok := ret.Get(0).(func(int) (int, error)); ok {
		return rf(id)
	}
	if rf, ok := ret.Get(0).(func(int) int); ok {
		r0 = rf(id)
	} else {
		r0 = ret.Get(0).(int)
	}

	if rf, ok := ret.Get(1).(func(int) error); ok {
		r1 = rf(id)
	} else {
		r1 = ret.Error(1)
	}

	return r0, r1
}

// NewDataProvider creates a new instance of DataProvider. It also registers a testing interface on the mock and a cleanup function to assert the mocks expectations.
// The first argument is typically a *testing.T value.
func NewDataProvider(t interface {
	mock.TestingT
	Cleanup(func())
}) *DataProvider {
	mock := &DataProvider{}
	mock.Mock.Test(t)

	t.Cleanup(func() { mock.AssertExpectations(t) })

	return mock
}
With the mock generated, let’s use it to write test cases for ConsumeData which has an external dependency on DataProvider.
// data_consumer_test.go
package test

import (
	"EvenOdd/mocks"
	"EvenOdd/service"
	"errors"
	"testing"

	"github.com/stretchr/testify/assert"
)

// TestConsumeDataForSingleInput tests the ConsumeData function with a single input.
func TestConsumeDataForSingleInput(t *testing.T) {
	// Create an instance of the mock
	mock := &mocks.DataProvider{}

	// Set the expected return value for the GetRandomNumber method
	mock.On("GetRandomNumber", 5).Return(3, nil).Once()

	// Call ConsumeData that using the mocked DataProvider
	result, err := service.ConsumeData(mock, 5)

	// Assert that the result and error are as expected
	assert.Equal(t, "Odd", result)
	assert.NoError(t, err)

	// Assert that the GetRandomNumber method was called with the expected input
	mock.AssertExpectations(t)
}

// TestConsumeDataForMultipleInputs tests the ConsumeData function with multiple values.
func TestConsumeDataForMultipleInputs(t *testing.T) {
	// Create an instance of the mock
	mock := &mocks.DataProvider{}

	// Set the expected return values for the GetRandomNumber method
	mock.On("GetRandomNumber", 20).Return(10, nil).Once()
	mock.On("GetRandomNumber", 30).Return(15, nil).Once()
	mock.On("GetRandomNumber", 10).Return(5, nil).Once()

	// Set the expected return value for an error scenario
	mock.On("GetRandomNumber", -1).Return(0, errors.New("Invalid id")).Once()

	// Added multiple inputs for testing
	testCases := []struct {
		input int
		want  string
		err   error
	}{
		{input: 20, want: "Even", err: nil},
		{input: 30, want: "Odd", err: nil},
		{input: 10, want: "Odd", err: nil},
		{input: -1, want: "", err: errors.New("Invalid id")},
	}

	for _, tc := range testCases {
		result, err := service.ConsumeData(mock, tc.input)

		// Assert that the result and error are as expected
		assert.Equal(t, tc.want, result)
		assert.Equal(t, tc.err, err)
	}

	// Assert that the GetRandomNumber methods were called with the expected inputs
	mock.AssertExpectations(t)
}
The first test case is with a single input. Whereas, if we want to write a test using multiple inputs, we can do it in a similar way as the second test case. Also, in second test case, I have added error scenario as well.
To run the test, go inside test package and run command (go test) :
go test

PASS
ok      RandomizedEvenOdd/test    0.400s
Voila! There you go!
In this example, the mock is used to simulate the behavior of the DataProvider interface, allowing us to control the output and assert that the interaction with the external dependency is as expected.
By incorporating Mockery, we can easily create maintainable and effective mocks for the interfaces, allowing us to write thorough tests for our Go code.
Code github link can be found in RandomizedEvenOdd.
Hope this helps in getting started with Mockery!
read more-
AWS Network Firewall for Egress and Ingress filtering
What is a Firewall?
A firewall is a system built to protect private networks from unauthorized and unverified access through an internet connection. Firewalls can be either in the form of hardware or software - or a combination of the two.
What is AWS Network Firewall?
AWS Network Firewall is a stateful, managed, network firewall and intrusion detection and prevention service for your virtual private cloud (VPC) that you created in Amazon Virtual Private Cloud (Amazon VPC).
With Network Firewall, you can filter traffic at the perimeter of our VPC. This includes filtering traffic going to and coming from an internet gateway, NAT gateway, or over VPN or AWS Direct Connect. Network Firewall uses the open source intrusion prevention system (IPS), Suricata, for stateful inspection. Network Firewall supports Suricata compatible rules.
AWS Network Firewall provides network traffic filtering protection for your Amazon Virtual Private Cloud VPCs. This tutorial provides steps for getting started with Network Firewall using the AWS Management Console.
Additionally, AWS Network Firewall provides extra features including deep packet inspection, application protocol detection, domain name filtering, and an intrusion prevention system. WAF, in contrast, can’t handle these features because it works on a different open systems intercommunication (OSI) model layer.
read moreDnD with React DnD for better UX

Drag and Drop (DnD) is a user interface concept using which one can select an object/element in the viewport and can move it (ie drag) to a desired location on the view port (ie drop).
Drag and Drop (DnD) makes it easy to copy, move, reorder and delete items with the help of mouse clicks. It is much more intuitive from the point of user experience than other user actions which may require clicking, typing etc. Often, the UI gets simpler and cleaner on account of using drag & drop.
Some of the different use-cases include uploading files, rearranging data in a table/section like in a Trello board, matching values in one section to an other value in another section.
read moreProvider: State Management in Flutter

State Management, be it in Android or iOS, is the most important part in any app development project. By managing state you make sure that data reaches where it is required.
State management is a strategic approach to organising all user interactions such that the created system state may be changed if any changes are needed to the user interface, databases, or other parts of the system.
Flutter has a built-in state management mechanism called setState(), however utilising it has the big downside of re-rendering the whole user interface (UI). The main flaw with this system is that even when a portion of the user interface doesn’t need to be re-rendered, it still is, which reduces efficiency and may result in high render latency or janky behaviour. Also we aren’t able to separate views and business logic with this approach so a better approach is to use Provider for state management.
read moreDistributed Logging & it's best practices

A log is perhaps the simplest possible storage abstraction. It is an append-only, totally-ordered sequence of records ordered by time.
As we all know Distributed system is composed of several applications calling each other to complete one operation. We might need to talk to multiple services running on different machines to fulfil a single business requirement. So, the log messages generated by microservices are distributed across multiple hosts.
What’s much harder is to make sense of this ocean of logs from a logical point of view. Here is what centralized logging comes to the rescue.
read moreElasticsearch-A distributed, free and open search and analytics engine
The Anatomy of a High-Performance Search Engine: Understanding Elasticsearch’s Key Components and Design Choices
Elastic Search is a powerful and versatile search engine that allows users to search, analyze, and visualize large volumes of data in real-time. With its ability to handle complex queries and provide fast and accurate results, Elastic Search is widely used by organizations and businesses to index and search through vast amounts of data.
read more10 Javascript hacks to become a pro

Javascript is a very popular & widely used programming language that can do a lot of amazing things! Check out these features/tips that will help you code like a pro.
read morePostgreSQL: A simplified guide to locking concepts
Recently, I have experienced certain problems while executing multiple transactions concurrently on top of Postgres while working on my everyday tasks in SIXT. This persuaded me to write this blog. While Postgres is amazing at running multiple transactions at the same time, there are a few cases in which Postgres need to block a transaction using a lock. One has to be careful about which locks a transaction should acquire and the high-level abstractions provided by Postgres are difficult to understand. With this Blog, I will try to demystify the locking behaviours in Postgres and give advice on common issues faced.
PostgreSQL has amazing support for executing complex, concurrent and ACID transactions. To make sure that concurrent/complex transactions run perfectly Postgres uses several layers of locks to serialise changes to critical sections of the database.
read moreReact 18 - useTransition vs useDeferredValue

React 18 focuses more on the user experience and performance. There are quite a few features that are introduced in this version like Automatic Batching, Concurrent features, New Hooks, New Suspense features, Strict mode behaviours.
For this article lets concentrate on two new hooks(useTransition, useDeferredValue) that are introduced and most importantly when to use them?
read moreHypothesis testing

Decisions can be made using gut feeling (instinct, guess, idea) or data driven, a simple example could be rolling 2 dice’s (cube) and predicting a single number (sum of the individual dice number), based on your gut feeling you might come with a single number but based on data driven decision you might choose 7 which has the highest probability. There could be many instances where decisions based on gut feeling would have given 100% success, but going with data driven decisions you can reduce the chances of failure. And the core of data driven decision making is Hypothesis testing.
What is Hypothesis testing?
“A statistical hypothesis test is a method of statistical inference used to decide whether the data at hand sufficiently support a particular hypothesis. Hypothesis testing allows us to make probabilistic statements about population parameters.” -Wikipedia
So basically, Hypothesis testing is like proving the gut feeling wrong based on the data which we collect :).
read moreGetting Started Hibernate Envers

In any application, auditing means that we track and log every change in all business objects, i.e, track each insert, update and delete operations.
Basically it involves tracking three things -
- What operation was performed?
- Who did it?
- When was it done?
Auditing helps us in maintaining history records, which can later help us in tracking user activities.
Hibernate Envers is a project that seeks to make auditing persistent classes simple. You only need to annotate your persistent class or a few of its attributes with @Audited if you wish to audit them. A table will be generated that contains the history of the changes made to each audited entity. Then, retrieving and analysing past data won’t take much work.
read moreCSS Combinators — A type of complex CSS selectors
Today, in this blog, we’re going to learn something very basic in CSS yet very useful and a must-know topic. It’s CSS Combinators !!
We will understand CSS Combinators by covering the different types, with an example of each type, and will also learn their importance, by combining them with other selectors.
read moreWeb Workers API: Multithreading in JavaScript

If you have been using Javascript, you may know, that it is a single-threaded scripting language that works within HTML files. This means only one statement is executed at a time.
However, we are also aware that JS has asynchronous behavior with which we can achieve concurrency. But, Asynchrony is not multithreading, as it is also dependent on a single thread. To some extent, even asynchronous operations block the DOM rendering on the browser.
Multithreading enables processing of multiple threads at once, rather than multiple processes. By incorporating multithreading, programs can perform multiple operations at once.
read moreHow to run mobile tests in parallel using Appium?

In recent years there has been increase in the growth of mobile applications across different business verticals. Most organizations are targeting to convert their user base into app users and as such there is an increase in mobile app development across platforms with android and iOS being the most popular choice.
With this increasing trend of mobile application development comes the bigger challenge of testing the mobile app to cover all customer scenarios as well as business use cases. Testing a mobile app poses its own set of challenges some of the common ones being:
- Testing on various models and various versions of the OSes to ensure the app is working correctly on all supported platforms and devices
- Frequent release cycles which demands such a testing is repeated very often
Elasticsearch Rollover Index — Automated way to get rid of old timeseries based data
In today’s world, applications and services churn out a huge amount of data continuously. And if you’re dealing with time-series data like logs or audit data points then you need to consider how to get rid of it after it becomes old and unwanted. The best way to achieve this is using Elasticsearch Rollover Index.
What is a Rollover Index?
When a new Elasticsearch index is created automatically for write operations as soon as the previous one becomes passive, it’s called a rollover index.
read more
Only the newly created index will be available for write operations and the older indices will become read-only. All these indices have to be under one alias so as to allow the user to read and write on the same Elasticsearch alias without worrying about handling multiple indices.Introduction to Test Containers: The Beginner's Guide
What do you think is worse? Testing your service with in-memory databases which would never go live on production or testing your service using mock data, the one which would come from a file or maybe a mocking framework. Nevertheless, in both cases who would test your assumptions and what if the implementation details change for the data you use in production, how will you ensure your mock data is correct? If you think neither of these is a good choice, then there’s a third option. What if you could test your service locally with much ease? If your answer is “YES” to the previous question, let me introduce you to the world of TestContainers.
What are TestContainers?
As per the official documentation, “Testcontainers is an open source framework for providing throwaway, lightweight instances of databases, message brokers, web browsers, or just about anything that can run in a Docker container.” They are essentially “Wrap around an API around a docker” which means you need to have docker installed on your machine. It allows us to run docker containers directly and are used in software testing to facilitate the creation and management of disposable containers for running tests. The necessary docker containers will be spun up for the duration of the tests and tear down once the test execution has finished, hence the term “disposable installation”.
This is the official website of this framework : https://www.testcontainers.org
Why do we need them?
Before I can get into TestContainers, let me introduce the “test pyramid”, a concept concerning the separation and number of tests for software. Unit testing, the base of the pyramid, in my opinion, does not require any further discussion. There has been so much written on the unit testing technique and tools that have been developed. Let’s talk about the integration testing stage.

The main purpose of integration tests is to check how our code will behave while interacting with other services. The dependency on installed components where the integration tests are designed to execute is a common issue while designing integration tests.
Traditionally, people use in-memory databases(example H2) to test their services. The major problem with it is that clients do not use H2 and test cases do not guarantee our code will work well with databases such as MongoDB or Postgres. Let us suppose, we are migrating from one version of postgres to another, and we are not sure if our changes are backward compatible. Test cases written against H2 will not catch bugs that occur due to incompatibility. We can easily overcome this using TestContainers and all we need to do is whenever we run a container we tie its version to whatever we are running on production.
Ultimately our aim would be to have a completely clean, up-to-date reproducible database instance which is meant solely for our tests. Docker containers are one of the most popular ways to set up a test environment on a continuous integration pipeline in advance for the services required to execute the tests. Now we have a library, known as TestContainer which compliments the integration testing well.
How to use the Test containers library in a spring boot project?
I will be discussing the basic setup of TestContainers(say postgresql) with JUnit 5. First, we need to install the required dependencies required for our use case-
testImplementation 'org.testcontainers:testcontainers'
testImplementation 'org.testcontainers:junit-jupiter'
testImplementation 'org.testcontainers:postgresql’
Next we need to understand two important annotations which might be required in our tests - @TestContainers and @Container. They tie the life-cycle of the container to the life-cycle of our tests. With the help of @TestContainer, test-related containers may be started and stopped automatically. The individual container life-cycle methods are called after this annotation locates the fields that have the @Container annotation.
In the example below, life-cycle procedures for the Postgres container will be used -
@Container
private static PostgreSQLContainer database = new PostgreSQLContainer<>("postgres:12.9-alpine");
Here we used the keyword “static” which acts like before-all and after-all and container starts once per all test methods in a class. If we do not use the keyword “static” it acts as before-each and after-each and the container starts for every test method in a class.
What happens behind the scenes?
Whatever we write in @Container is being essentially converted into a docker command.

● The TestContainers library establishes a connection to the machine’s running docker daemon first (The docker daemon or dockerd listens for docker API requests and manages docker objects such as images, containers, networks, and volumes).
● Next, it searches for a postgres container using the image properties specified in the test.
● It lets the daemon pull the docker image with the required version from the official docker hub registry if it is not already present, otherwise it pulls the image from the local cache.
● The postgres container will then be started by the daemon, which will then alert TestContainers that it is ready for use. The daemon also sends some of the container’s properties. These properties include the host name and port number.
Note : The default port for postgres is 5432 and it uses this port internally within a container which would be mapped to a high level random port on our local machine.
Random ports are generated at run-time to prevent port clashing.
● The application has access to the container’s properties, which it can use to establish a connection with it. To check for which host and port to connect on we can ask the postgres container which port to connect to.
Conclusion
TestContainers is a powerful tool that can simplify the process of setting up testing environments without having to worry about configuring complex infrastructure or need to install the dependencies. It makes our integration tests a lot more reliable. The only downside is that these tests are slow compared to in-memory approaches as it takes time to pull the image and start the container. But in my opinion, the advantages outweigh the disadvantages.
You can also visit the GitHub repository for more implementation details. Thanks For Reading!
read moreA technique to achieve test automation within the sprint
In my experience, most of the QA teams won’t attempt to create automation scripts for the features within the same sprint in which they build/develop, and these two activities (creating the feature and automating them) together can easily expand beyond the sprint life cycle.
First of all, we need to understand why we need in-sprint automation. This will introduce risk as well as technical debt. Any functional testing done within the life cycle of the sprint usually focuses on the feature story itself and not on complete regression of other parts of the product. The automation task for the current sprint features goes to the backlog or for future sprints.
And, thanks to in-sprint automation, we can easily end all of the preceding points. The benefits are:
⁃ Most of the time, the development processes get delayed due to the time the QA team needs for testing. A feature needs to be tested along with others to ensure seamless integration. With the help of In-Sprint automation, we can save time and ensure there are no leftovers or backlogs for the current sprint.
⁃ With Insprint automation, we can ensure the business can achieve their development goals in the first build and the ongoing adjustments will require less time since there are no repeat processes involved.
read moreOKR Learning Path

When the company decided to go with OKRs in order to strengthen customer centricity throughout the whole organization, there was a huge lack of knowledge about the topic. We SIXT Agilists were asked to support this transition by teaching divisions and the new role of OKR Champions how to start and run OKRs.
First, we had to train ourselves. Some of us Agilists had already attended OKR classes - now it was about internal knowledge transfer. We pulled back ourselves and learned about what OKRs are created for, about the history, the values, the idea behind, the differences between OKRs and KPIs … in short: We gathered everything which might be relevant to understand and master the topic. The result was great: We all managed to get a certification as OKR Professionals. With all the gathered knowledge we were ready to teach the world.
read moreAutomatic dependency updates with Dependabot

As the project grows, the number of dependencies used in the project grows too. It’s very crucial to maintain them to have a state-of-the-art product. There is no way in Android Studio that can manage these updates for us. You have to do it manually. Usually, the process involves checking if a new dependency version is available, checking what’s new or reading changelogs, and then bumping the version and creating a PR.
We were doing exactly the same. It was a tedious task for us. That’s when I decided to automate this process. During research I got to know about Dependabot - version update system. This article is about how to automate dependency updates using Dependabot and how to handle its limitations.
read moreGolang's Atomic

Golang is a language which excels at parallelism, with spinning up new goroutines being as easy as typing “go”. As you find yourself building more and more complex systems, it becomes exceedingly important to properly protect access to shared resources in order to prevent race conditions. Such resources might include configuration which can be updated on-the-fly (e.g. feature flags), internal states (e.g. circuit breaker state), and more.
read moreSIXTtech @ hackaTUM 2021

We are a proud sponsor of the 2021 edition of the hackaTUM. It’s the official hackathon of the Department of Informatics of the Technical University of Munich. It takes place from Friday, 19th November til Sunday, 21th November. Unfortunately because of COVID-19, it’s an online-only event.
read morePublic Service Announcement on Slack Webhook Security
While experimenting with different tools for detecting hard-coded credentials, we noticed that some (like GitHub Advanced Security) point out Slack webhooks if they appear in code. At first, we mostly ignored those since they seemed like fairly low risk if any at all. Then, just for fun, we added the pattern to our own home-grown scanner
read moreThe Bot Saga

There comes a time in the lifespan of all large websites when bot traffic becomes an issue on some scale or another. Sometimes you get bombarded with scrapers and your servers can’t handle the load. Sometimes malicous users attempt to brute force security-related endpoints. Sometimes bots drop spam content into input fields. Regardless of the usecase, eventually the problem grows enough that it needs to be addressed somehow.
This happened to us, and here’s the long road we traveled.
read more
subscribe via RSS